
Brady Scorecard Scam
I love it when ideologues prove the oppositions’ point.
 Every year the Brady Campaign – the aging gun control group with fading influence – publishes their scorecard of state gun control laws, listing which states have “strong” gun control and those with “weak” ones.
Every year it makes me chuckle.
The source of the humor is that a simple diagram shows the meaninglessness of their analysis. Every year I plot states by the Brady Campaign ratings against various forms of crime, and every year there is no covarience. None. It is a simple yet savory summary that gun control laws make no difference in crimes of violence.
But this year I noticed something I had never noticed before.
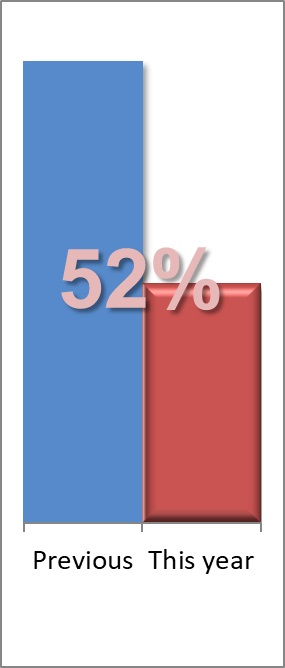
On the far left of the chart is California, state that the Brady Campaign believes has the strongest gun control laws. It ranks #1 according to Brady. On the right is #50, Arizona, the state with almost no gun control at all. [click to enlarge]
They have nearly identical violent crime rates. California has 423 violent crimes per every 100,000 residents and Arizona has 429. Not a dime’s worth of difference.
To my growing group of reporter friends: Don’t bother covering the Brady Campaign Scorecard story next year. The stats show that the story is meaningless.
So what State does each dot represent? Just curious.
Good question. I had to acquire some new software to automatically add all state state labels. Here is an updated chart.
http://www.gunfacts.info/wp-content/uploads/2015/03/brady-campaign-state-scorecard-2-state-labels.png
Hello! Would you happen to have a specific link for the FBI data on the violent crime rate rank?
The Universal crime Reporting data can be had online at http://www.ucrdatatool.gov/. Their web site appears to be down today, but normally it is available.
California may have a high violent crime rate, but it does not have a high gun death rate. The UCR definition of “violent crime” includes many crimes that are not, or do not have to be, committed with guns. Look at their definitions for murder, robbery, rape and aggravated assault: none of them exclude crimes committed with knifes or your bare fists. https://ucr.fbi.gov/crime-in-the-u.s/2012/crime-in-the-u.s.-2012/violent-crime/violent-crime Gun deaths also include suicides with guns, which far outnumber homicides. I would take a closer look at your analysis; it does not seem to prove what you think it does.
Thanks for the polite comment.
Much of what you say is well understood (such as suicides), though some is inaccurate. For example, California is #13 in the nation for gun homicides (ignoring D.C., a huge outlier), with a rate of 3.4/100K, well above the national average (sans D.C.) of 2.5.
https://en.wikipedia.org/wiki/Firearm_death_rates_in_the_United_States_by_state#Murders
In the Non-Brady Scorecard, we examined each category of violent crime as well as the aggregate. I’m assuming that you did not download the full report.
Out of curiosity, what is your role with NY Public Radio (I noticed your sending email node was smtp.nypublicradio.org)?