Stanford Stumble
’m having doubts about Stanford University. My wife died in their care, and now they are supporting some suspect researchers who like to mathematically model non-lucid, if not outright insane, crime stats.
Quick Take-Aways
- Paper claims right-to-carry (RTC) laws increase violent crime by 13–15 percent.
- Uses mathematical modeling to “predict” what crimes rates would have been without RTC.
- Serious methodology flaws.
The usual suspects
The paper in question (“Right-To-Carry Laws and Violent Crime: A Comprehensive Assessment Using Panel Data and a State-Level Synthetic Controls Analysis”) received some press notice, but not as much as I would have expected given the paper’s outsized conclusions. Perhaps reporters are getting smarter about the quality, or lack thereof, of some gun policy research.
The list of sins in this paper are monumental. It is good that this is just a “working paper” and not published in a peer review journal, which given its lack of methodology rigor, means the paper might never be seen in such periodicals.
Synthetic Control
Without getting into arcane details, “synthetic control” methods are mathematical systems for evaluating the effects of something (e.g., right-to-carry laws) with a control group. This, in and of itself, is not bad; but done wrong, it is a handy tool for deceiving people.
In theory, the researcher wanted to compare a state that had passed RTC against states that had not. The problem is that the comparisons were irrational.
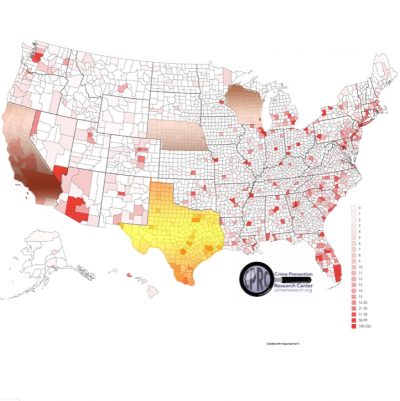
 Take Texas. Texas’s RTC law came into effect in 1996. At that time, there were 19 states that had no RTC, providing a vast range of data to use. But the researchers only paired Texas with California, Nebraska and Wisconsin. I snapped a copy of a recent county-by-county homicide maps created by the Crime Prevention Research Center to make a few points here (the three control states are in a copper hue).
- Only California has a border problem similar to Texas (unless bands of dope-smuggling Canadians are routinely entering Wisconsin).
- The homicide maps show that two of the comparison states have almost no homicides, and thus likely have similarly low rates of other violent crimes.
- Culturally, things could not be more different. Imagine if they compared Alaska with New York.
The researchers noted that they chose these states for mathematical convenience, and not for the sharing of critical dependent variables well known for association with violent crimes. The bigger question is why they did not tally Texas against all remaining non-RTC states for some reasonable pre- and post-enactment period.
Clumping, like cat litter
There are many forms of violent crime, and each has different responses to RTC.
For example, most rape occurs in homes. RTC is very much a street-protection mechanism. Thus, RTC is not applicable to rape, by and large.
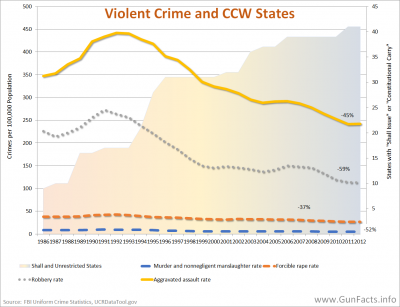
 The researchers lumped all violent crime together. For some research, aggregate violent crime rates are okay to use. For RTC, which has this very public aspect to it, aggregation is inappropriate. This chart shows the great disparity between different forms of violence, with aggravated assaults leading the pack. Aggravated assaults, and robberies, tend to occur frequently in public, and expanded RTC may have contributed to their decline throughout the 1990s and early twenty-first century.
RTC <> Really Tight Controls
RTC laws are not identical. I don’t have the time to dig into all forty-two of them, but some researchers have claimed that the variability in permitting requirements is vastly different enough, that this study should have taken into account this variable. The notion is that those states that passed RTC later on made the process more restrictive (e.g., Illinois, where in Chicago it is very difficult to obtain a permit). This would skew the stats significantly, especially with the quasi-cherry-picking synthetic control models used.
Intrastate Effects
One huge problem is that even states that have RTC may have backyard problems that bend the curve on the overall numbers.
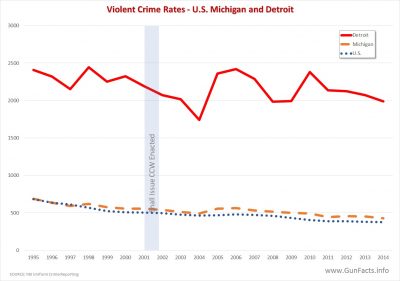
 Let’s look at Michigan. By and large, Michigan has a violent crime rate slightly higher than the US as a whole. But it also has Detroit, major portions of which resemble a war zone … because it is one. Were Michigan not dealing with the murders in Motown, the overall state crime rate would drop dramatically.
Yet this paper does not appear to take this into account. The same could be said for Illinois, which technically speaking is an RTC state, but also has to deal with Chicago’s South Side. Likewise with Washington State and the violence cluster around the Seattle/Tacoma region.
Crime and Time
Take the observation above, and pair it with the fact that violent crime fell from its peak in 1993 to nearly all-time lows today. If one is modeling recent RTC states against non-RTC states who have enjoyed falling crime rates as well, then we see statistical flux – small movements in crime in the RTC state amplified against a national trend.
Part of this is that along with coast-to-coast and border-to-border RTC (with a few slovenly hold-out states) came many other get-tough-on-crime bills. As we noted, much to the chagrin of the Law Center to Prevent Gun Violence, California’s sudden and steep drop in violent crime last century was not from gun control laws, but from two laws targeting crime, including one specifically targeting gun crime. This is non-trivial because, as California shows, a non-RTC state with a steep decline in crime due to anti-thuggery laws will pervert the comparison with RTC states. Indeed, since California’s violent crime rate was head-and-shoulders above most of the country in the early 1990s, using California in the control group of the synthetic control method produces a huge bogey.
The Invisible Elephant
However, the one thing not mentioned in this study is the known violent crime rates of concealed carry licensees (CCW). From the states that report these details, we see CCW holders commit nearly no crimes. Statistically null. If RTC induces violence (which it does not), then it would have to do so indirectly. Any indirect association has at least one other variable involved, and this paper does not explore that.
Index and Ignore
The gun control industry will continue to pimp this paper, so you need to index this summary of this rather bizarre paper and feed the link to anyone thinking Stanford gun policy researchers are worth further consideration.


Just in case people don’t realize how bad your “invisible Elephant” truly is. The Donahue model for Florida alone predicts 3,000 additional violent crimes due to RTC. Florida’s average conviction rate for CCW holders for improper use of their firearm is about 6 (since 1987). His synthetic model has predicted 500 times more CCW criminals than actually exist. This is just one example of the many problems with this absurd paper using imaginary states.
“There are three kinds of lies: lies, damned lies and statistics.” – Benjamin Disraeli
The gun control crowd understands this quite well, as virtually ALL of their published numbers illustrate. Any time they use math to make a point you can wager that a review will show a not inconsiderable amount of skewing.