
Cali Crossroads
Are gangs on the run in Los Angeles?
No, but their violence may be abating, and it has nothing to do with gun control.
The state of California (a.k.a. the State of Emergency) recently published a pair of decadal crime reports. Buried in the data is evidence that despite a backward-thinking mania, California has enjoyed a drop in violence without an increase in gun control. At first blush, the decline appears to be uniquely tied to Los Angeles County, and to a brace of 1993 era laws that targeted criminals.
The big take away is that from 2005 through 2012 (the latest date for which we can compare Cali stats against the rest of the nation) California violent crime has shrunk impressively. Part of this is due to the fact that the rest of America is not the violent cesspool known as L.A.! SoCal can only improve, edging ever closer to the low violence rates of the remaining American terrain. But improve it has.
Gun control didn’t
Foremost, we have to recognize that gun control did nothing. With state-level preemption, the only thing Los Angeles or any other district could do between 2005 and 2012 was buy guns from citizens, which study after study shows has no effect what-so-ever (for newcomers, guns brought to so-called “buy backs” are almost entirely antiques and rifles, none of which have ever been used in crimes, and hence not part of the problem).
Yet during this period, there was little in the way of new gun control. According to the Cal Guns Foundation timeline, the Golden State only banned open carry of handguns (which nearly nobody was doing). That law, passing in 2011, would not have bent the curve at the end of the 2005-2012 period. One might argue that a 2003 bill to revise the Handgun Safety Certificate program made a difference, but given that the Bureau of Justice Statistics confirms most crime guns come from unregulated street sources, this is nonsensical.
So, we have a period of seven years with no meaningful new gun control laws, but a sharp drop in crime compared to the rest of the nation. The question is “WTF?”
Los Angeles … where all angels are lost
To understand California crime (and guns) you have to understand L.A.
| Homicides 2005 | Reduction | 2005 Rate | 2014 Rate | |
| Statewide total | 2503 | 37% | 7.0 | 4.4 |
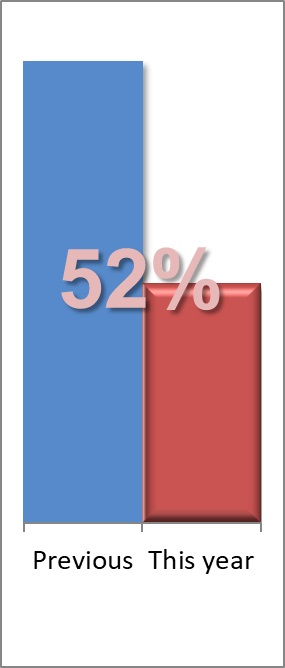
| Los Angeles | 1068 | 52% | 10.9 | 5.2 |
| San Diego | 98 | 30% | 3.3 | 2.3 |
| Orange | 77 | 27% | 2.6 | 1.9 |
| Riverside | 109 | 27% | 5.6 | 4.1 |
| San Bernardino | 174 | 41% | 9 | 5.3 |
| Santa Clara | 43 | 16% | 2.5 | 2.1 |
| Alameda | 126 | 26% | 8.6 | 6.4 |
| Sacramento | 110 | 32% | 8.1 | 5.5 |
| Contra Costa | 80 | 46% | 8.0 | 4.3 |
| Fresno | 77 | 31% | 8.8 | 6.1 |
| Homicides and homicide rates for the top-ten California counties by 2005 population estimates | ||||
Though L.A. experienced an impressive 52% decline in homicides over 10 years, at the beginning it accounted for 43% of California murders with only 27% of the state’s population.
From a policy perspective, controlling L.A. violence was a priority. But missing from the political rhetoric was the fact that gun laws were uniform across the state. If the citizens of Los Angeles had to jump through just as many gun control hoops as the residents of Amador City (population 185), then the violent crime rate should be lower in both places. But it isn’t, even after nine years of improvement (in 2014, L.A. county had 31% of the state’s homicides).
What happened in la-la-land?
Our first big clue then is what changed in the state and in Los Angeles. Sadly, the reports from the California Department of Justice did not break down all crime categories by county. But given L.A.’s outsized population and crime rate, and the reduction in L.A. homicides, the state-wide changes in violence are likely a result from L.A.
|
||||||||||||||||||||||||||||||||||||||||||||||||
|
||||||||||||||||||||||||||||||||||||||||||||||||
|
||||||||||||||||||||||||||||||||||||||||||||||||
This becomes apparent when three major groupings of violent crimes are broken-down across an arbitrary metric, in this case the race of the victim. The rate of arguments that result in homicides is relatively flat across the three primary races. But the rate of gang homicides across races is not. Since gang activity is economically and geographically aligned (poor people in inner cities are more likely to become gang members), the over representation of California Hispanics and blacks committing and being victims of gang homicides is staggeringly high.
First, homicide numbers are available by county. As you see in the table above, L.A. had a homicide rate over six times higher than the next most violent county in the top-ten (by population) list. Gun control mavens claim California’s strict gun control is the answer, but since results are not state-wide and since this silliness has been debunked before, we can skip past that. But let’s take a look at one interesting indicator.
Though all categories of violent crime in California fell, we see the most significant reductions in gang/drug related crimes and from arguments. Yet one poorly kept secret in criminology is that the Uniform Crime Statistics do not break down what fatal arguments were about. If a gangster from the Crips starts an argument with a member of the Bloods, and they gun one another down, it is recorded as a homicide by argument, not gang related. For the sake of keeping things clean, we have to accept that “argument” is too broad of a classification. Hence, gangs represent the largest decline in violence.
It is no secret that gangs like using guns, but they also routinely use knives and baseball bats. One would expect to see a decline in gun homicides if there was a reduction in gang homicides. They did decline, but so too did non-firearm homicides, though at a lower rate.
Summarizing: L.A. is a hideously violent place, but it has gotten better, homicides (and especially gang homicides) are dropping regardless of the weapon used, and this occurred during a period of no significant gun control legislation.
Falling, gang-busters
There are two primarily approaches to reducing gang violence: make people not want to be in gangs, and put gangsters in jail for very long periods of time.
I only had a moment to look into the former, but it did not appear promising. A gang reduction program for Los Angeles showed lackluster results. From the study we see:
- … Gang Reduction Program (GRP) was a targeted multiyear (2003-08) initiative to reduce crime and violence associated with youth street gangs in a select group of cities throughout the United States (including L.A. from which the following were reported)
- … no significant differences were found for calls to report vandalism, serious violence incidents, and gang-related serious violence incidents.
- … nonsignificant decreases in the number of gang-related serious violence incidents were reported in the target and displacement areas …
In brief, a program designed to keep people out of L.A. gangs during the period in which gang violence was dropping had no measurable results. Conning kids to stay out of gangs didn’t slow the blood flow.
But as we saw with the first decadal report on California’s three strikes law, putting former gangsters in the slammer does. The interesting thing about Three Strikes and the 10-20-Life laws, which specifically target criminal misuse of guns, is that the effects are perpetual as long as the courts enforce them.
The right control
In L.A., controlling gang members has proven to be the right way to control violent crime (or at least the largest buckets of it). In the absence of significant gun control legislation, the L.A. commissioners’ recent decision to become NRA lawsuit bait by passing meaningless local gun control laws is at best a misinformed effort, and at worst a cynical ploy by corrupt politicians … err … this is L.A. we are talking about, right? Perhaps I am being redundant.
I shared the article on “Guns in Other Countries” on Facebook and one of my critics pointed out that according to that chart Syria has no deaths by guns? Can you explain this since it doesn’t make any sense? Thanks.