
Gun Violence Audit – 2025
You have to be a little crazy to take gun violence analysis to the extremes we do.
This article, an audit of many things we can derive from the FBI’s database of 13,916,425 crime victims in 2023, is just the latest example of our data derangement.
Take-aways
- 87% of gun crimes result in no or only minor injuries. Deaths occur in 10% and serious injuries in 3%.
- Only 40% of gun crime offenders are arrested in the same year.
- Arrest rates fall sharply in high-population counties.
Wholesale Data
We have a project at Gun Facts that we jokingly named “Data Whore” while conceptualizing it. Unfortunately, the name stuck, and it appears in too many places within our internal systems to change now.
The goal was to establish a database system (PostgreSQL, for the geeks out there) to load in long-term data and thus be able to correctly extract details at whatever level is needed. Thus far we have FBI Supplementary Homicide Reports going back to 1976, some county-level population and demographic dope, and two years of the FBI’s new National Incident-Based Reporting System (NIBRS).
Compared to the old Uniform Crime Reporting (UCR) system, NIBRS is massive. Data rich. Many more detailed variables. Which is why when the FBI switched to NIBRS in 2021, during the pandemic, the underreporting level was staggering. Underreporting by agencies across the country was so bad that we did not bother loading the 2021 data into DataWhore.
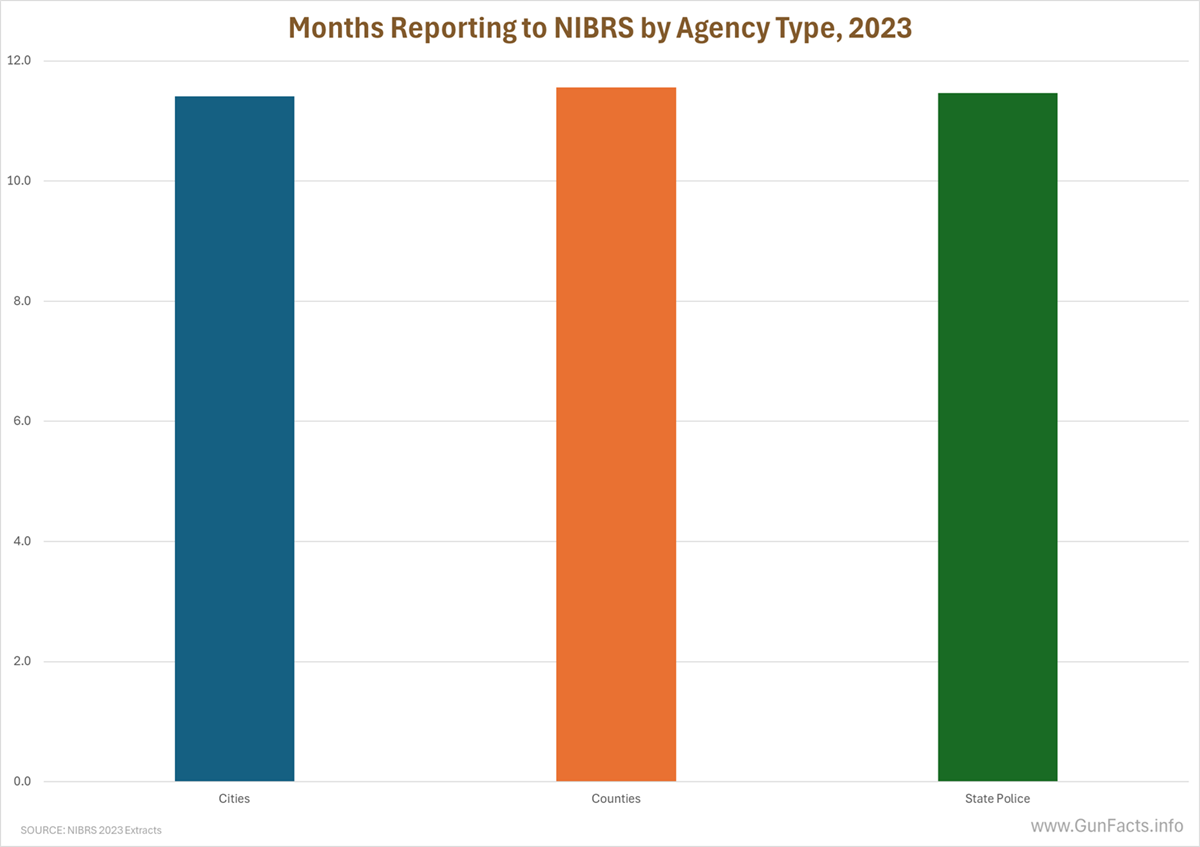 By 2023, reporting was robust – 97.6% of all agencies reported all 12 months. There are many other types of agencies than just city, county, and state police, but they either report to other agencies (“covered by” in NIBRS parlance), or are small/specialized agencies (college campus, tribal lands, etc.) that as a percentage of the population are tiny. For this analysis, we largely stick to the three primary agency types.
But then again, Los Angeles.
They did not transition to NIBRS until March of 2024. Hence, the region known as the “gangsta paradise” is not in the 2023 data on which this study is based. With a population of 3.9 million people, or about 2.8% of the US population, that’s quite a gap, at least for California.
What Types of Gun Crimes
All gun crime is important, but some crimes involve guns either often or rarely.
 |
 |
 |
 |
Across all states, we see many unsurprising things and one cute FBI classification anomaly.
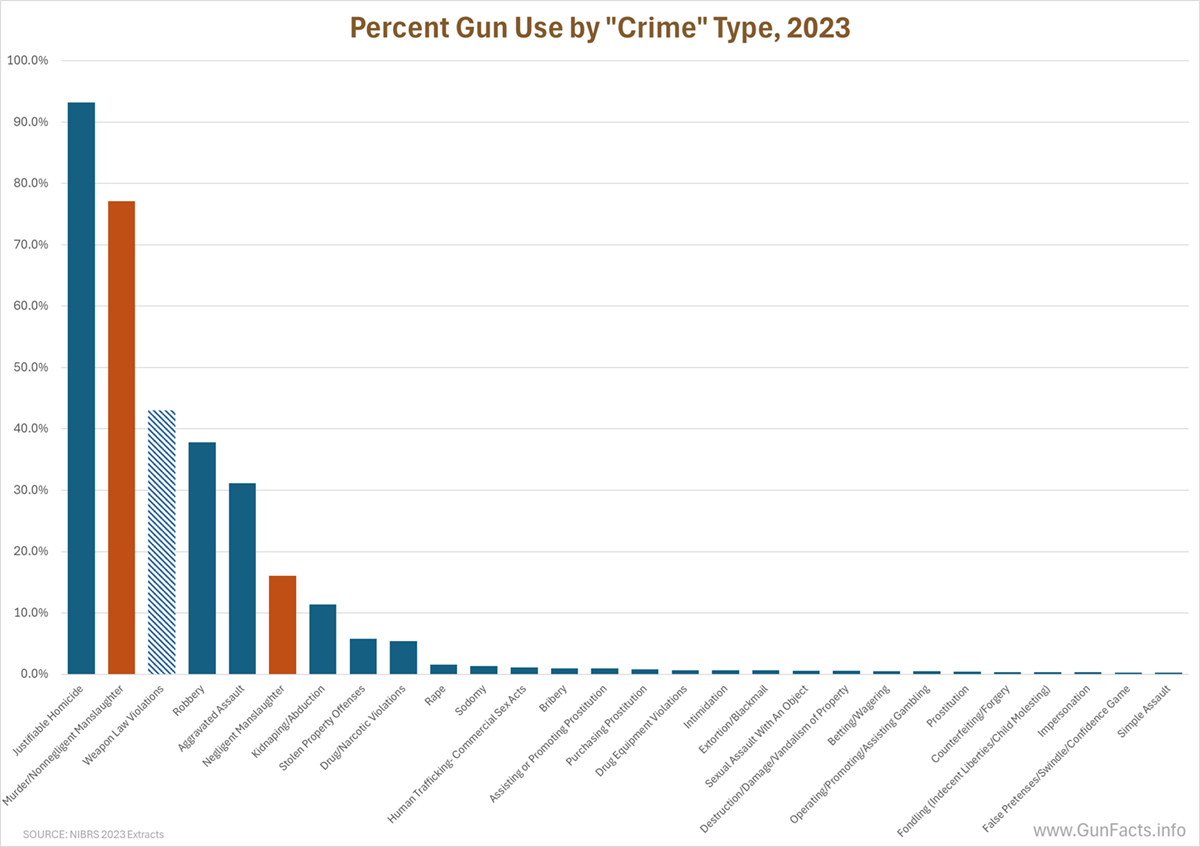
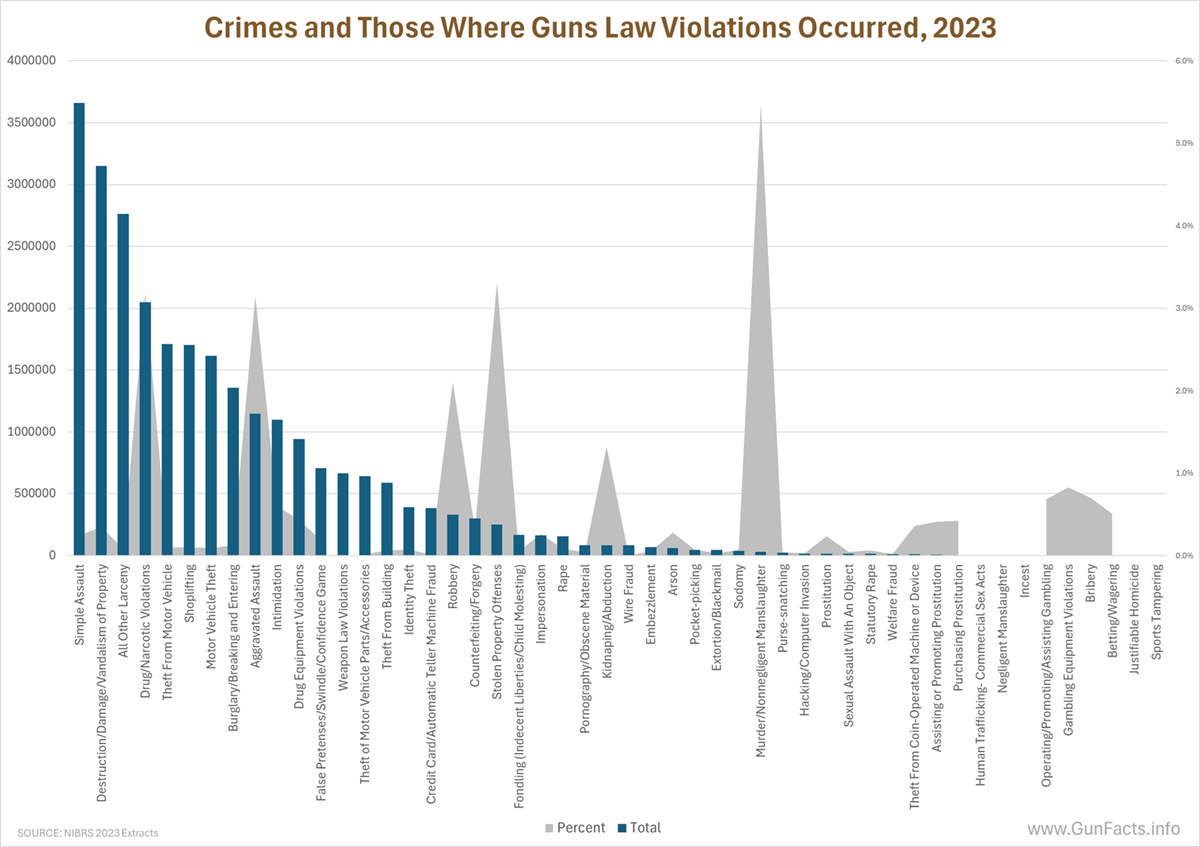
For reasons I can understand but dislike, “Justifiable Homicides” get captured as “crimes.” I get it – you want consistent and robust reporting of any time someone gets shot (including by police). And often a justifiable homicide is initially classified as a homicide while the investigation is conducted. But still…
This chart shows what percentage of each type of crime involves a firearm. Unsurprisingly, guns figure into murders and non-negligent manslaughter most frequently. But after murder are weapons law violations, which include unlicensed public carry, unlawful possession, inappropriate brandish or discharge, illegal sale or distribution, illegal manufacturing, possessing outlawed weapon types, and possession in a restricted location. Aside from intimidating discharges, though, none of these are crimes of violence or even property crimes.
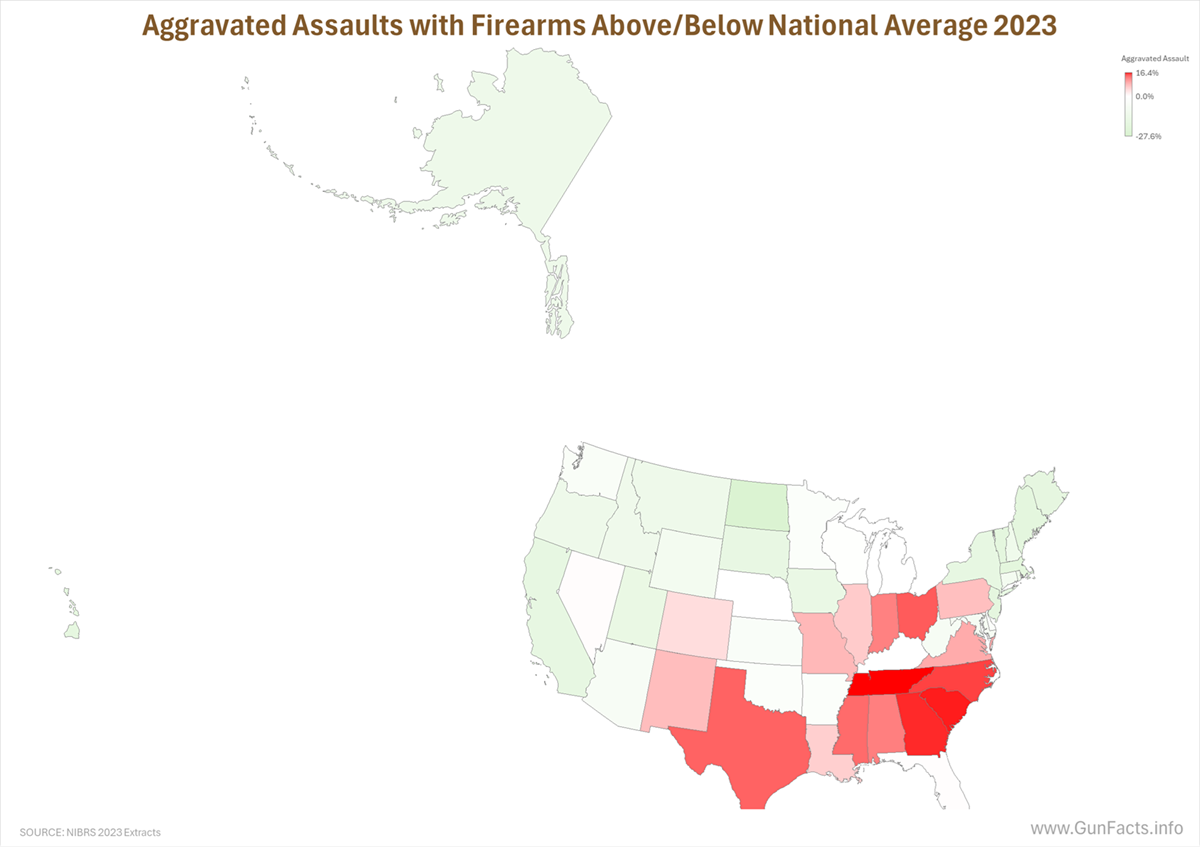
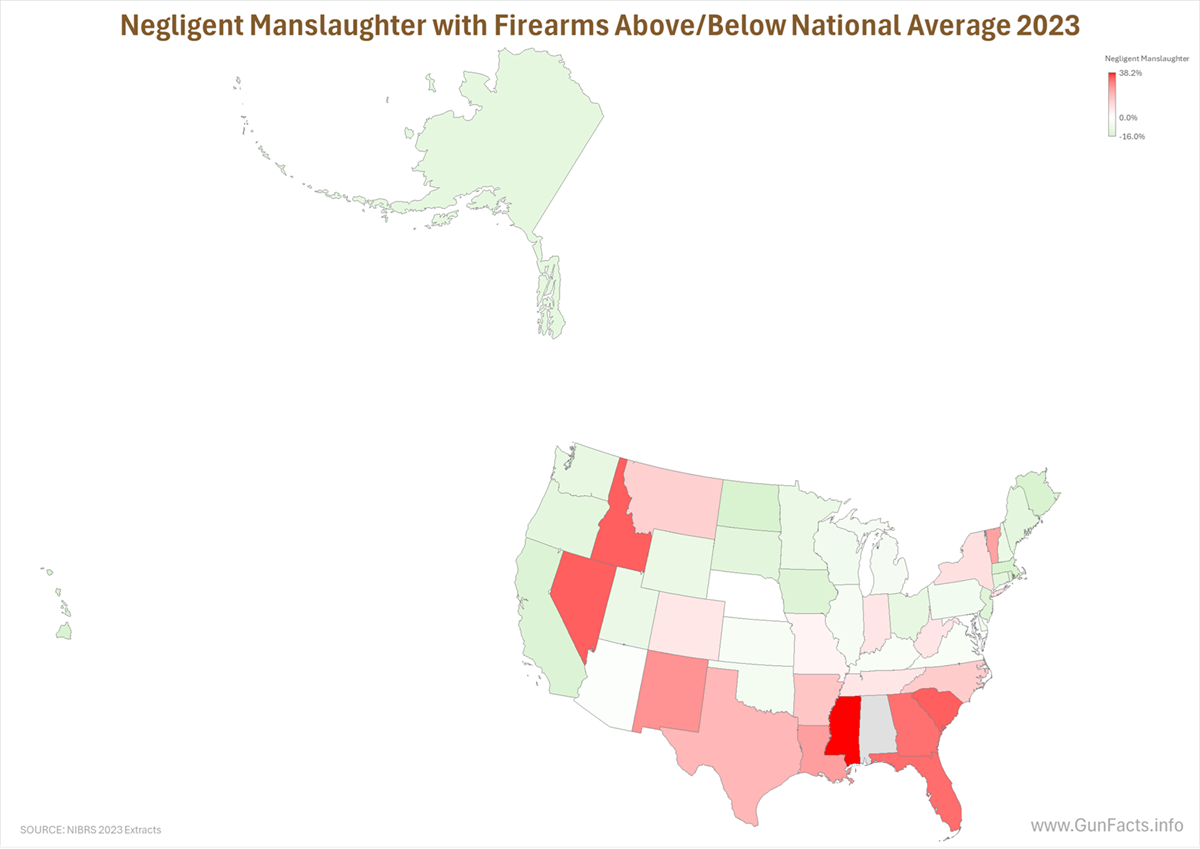
A wrinkle is that the rate of gun use in each crime category is inconsistent from state to state without any strong correlations. This subset highlights when a state has a rate of gun use in a crime category 10% or higher than the national average.
Looking at just state differences, without diving deeper into demographics and such, should be taken lightly. But it is worth exploring since some types of crime where guns figure into the picture matter, and the spread of the rate of gun use is significantly different.
Aggravated assaults 1 are heavily concentrated in the Southeast, though some of the rust belt states are prone to using guns to assault people.
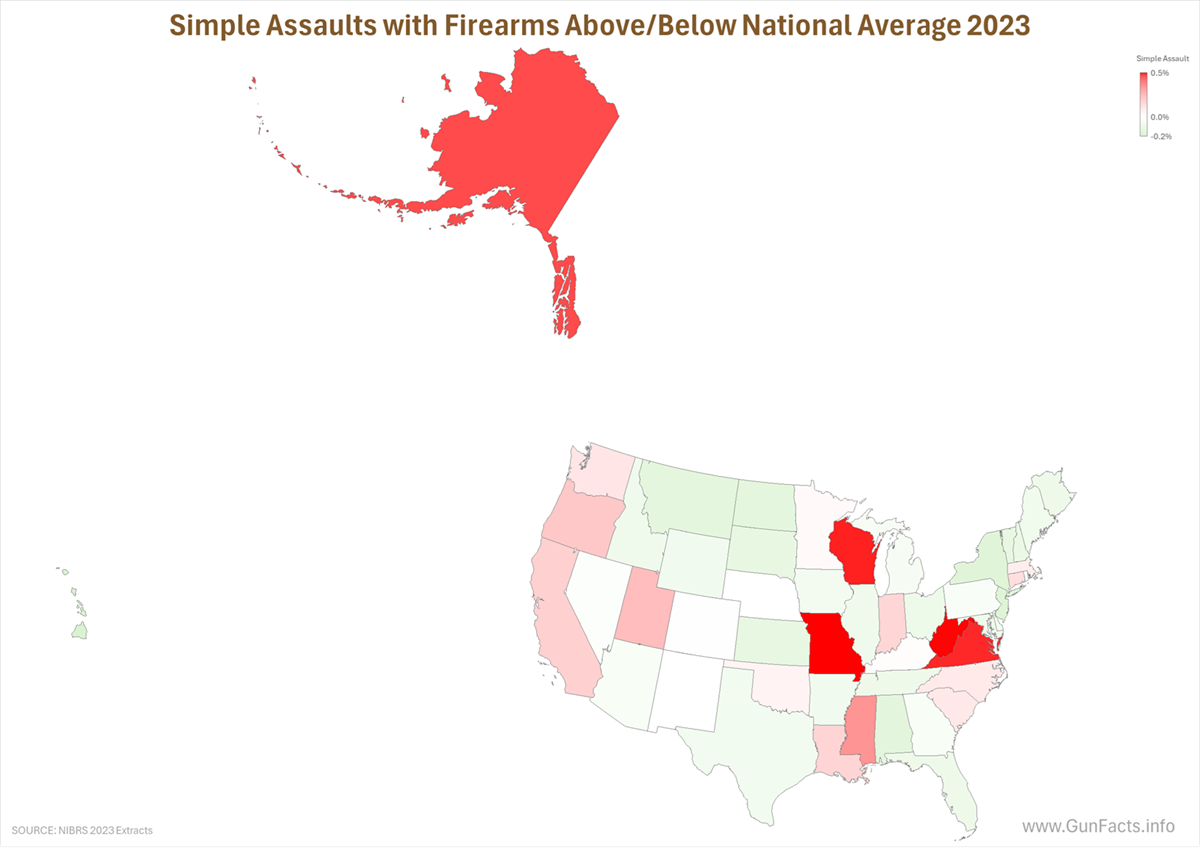
But those are attacks with intent to do serious harm. Simple assaults 2 are another story.
These cases where harm was not the original intent, but guns come into play, show a few interesting elements. Illinois (Chicago) is, of course, a hot spot where spontaneous street gang interactions are hourly occurrences. Likewise with Missouri, which has significant gang problems in a couple of cities, mainly St. Louis.
The most interesting bit is the West Coast. Whereas they were below averages for aggravated assaults with guns, they are above with simple assaults escalating to gun use (this despite California, Oregon, and Washington State’s collective braggadocio about local gun control laws). Like in other states, large metro areas drive violence curves and the type of violence is influenced by local culture and local law enforcement presence.
The last curiosity chart involves when someone died from unintentional gun fire. “Negligent Manslaughter” is a rather broad category, ranging from hunting accidents, to a small child who found a loaded gun, to your weird cousin Cletus who looked down the barrel of the gun he was cleaning. Though these deaths skewed a little to the South, the Idaho and Nevada band show likely differing causes. So too with pinkish New York and West Virginia (for the record, New York was 4.6% above the national average while West Virginia was “only” 4.0% above).
In a future study, we’ll explore these differences in rates of specific crimes with guns against gun ownership rates, demographics, and more. But our past investigations of state-level comparisons have been inconsistent and inconclusive, mainly due to the combination of most violence being centered in major metropolitan areas and reactive changes in policing due to violence (except for Chicago, which is perpetually violent, and which perpetually understaffs their PD).
When a Gun Crime is not a Gun Crime
As we noted above, “weapon law violations” were the second largest actual crime category in the database. But we know from long experience that such violations are “add on” charges when someone is busted for a different crime (e.g., burglary) and the cops find them with a gun they should not have (i.e., felon in possession).
 |
 |
 |
 |
The data shows that a few categories of primary crime (first offense logged) have “weapon law violations” as secondary or tertiary offenses.
All in all, 28% of the time when a “gun crime” is a “weapon law violation” it was an add-on charge.
Some of these are pretty obvious (murder, 5.5% of the time), while others are not (stolen property, 3.3%). The point is that the top-line “gun crime” statistics reported by some activist groups may be overstated when they include these add-on charges.
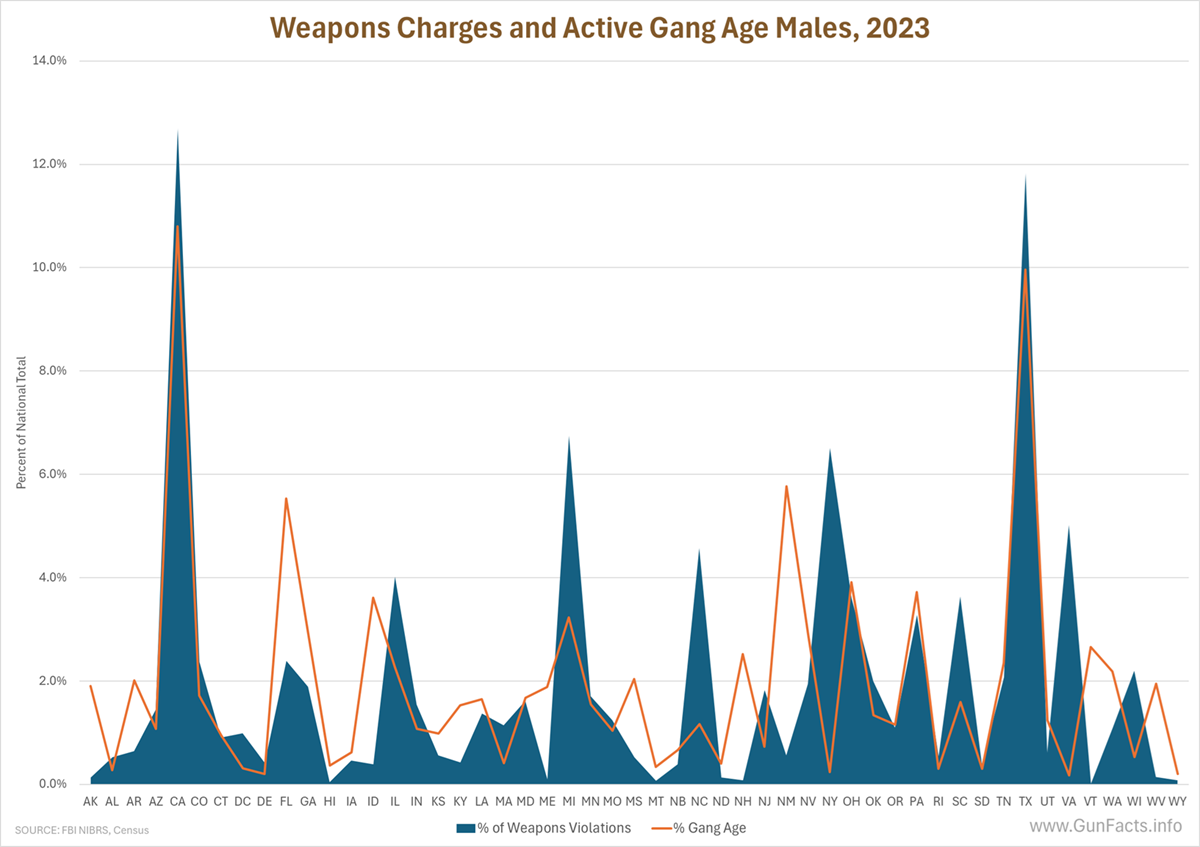
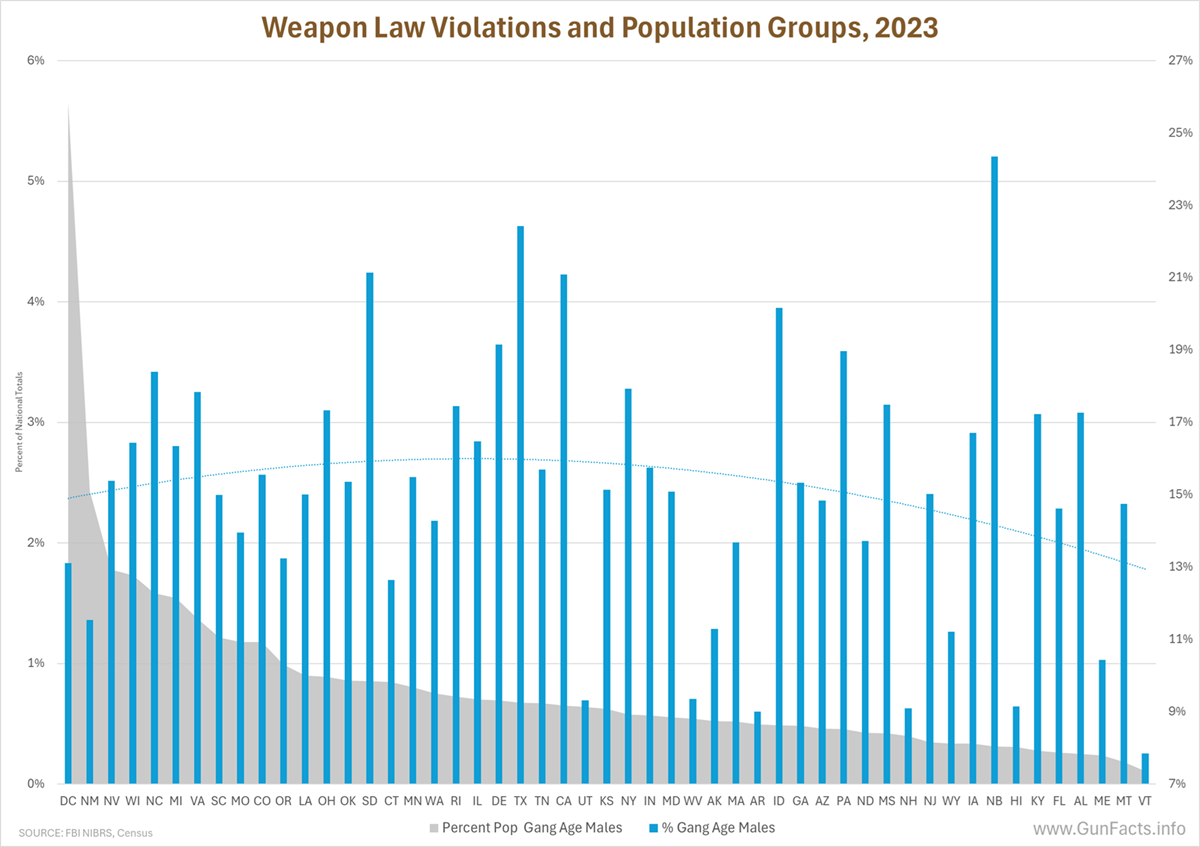
But weapon law violations are often enough crimes on their own, and this chart shows the percentage of crimes where the primary charge was a weapon law violation against each state’s overall population and their street gang male population for the most active ages for street gang activity, ages 14 through 24.Ther are minor differences in the curves, but there are plenty of oddities to consider. For example, the huge spike is Washington, DC, which on a per capita basis is the Murder Capital of the United States.
When we dig in a little more, we see that the rate of primary offense weapon law violations in each state compared to the number of males of street gang age is very inconsistent. In California, the rate of busting a male in the gang-active age group is low compared to that population. In Texas, that rate is inverted.
There are a myriad of explanations for this, but one is that if local law enforcement is focused on street gangs or their members, and in a way that allows interdiction before the young male does something more serious than a weapons law violation (i.e., advances from carrying concealed illegally to killing someone). For now, this view is advisory at best.
Race and Injury
At Gun Facts, we loathe discussing race. But we must because the numbers tell us there are differences in outcomes.
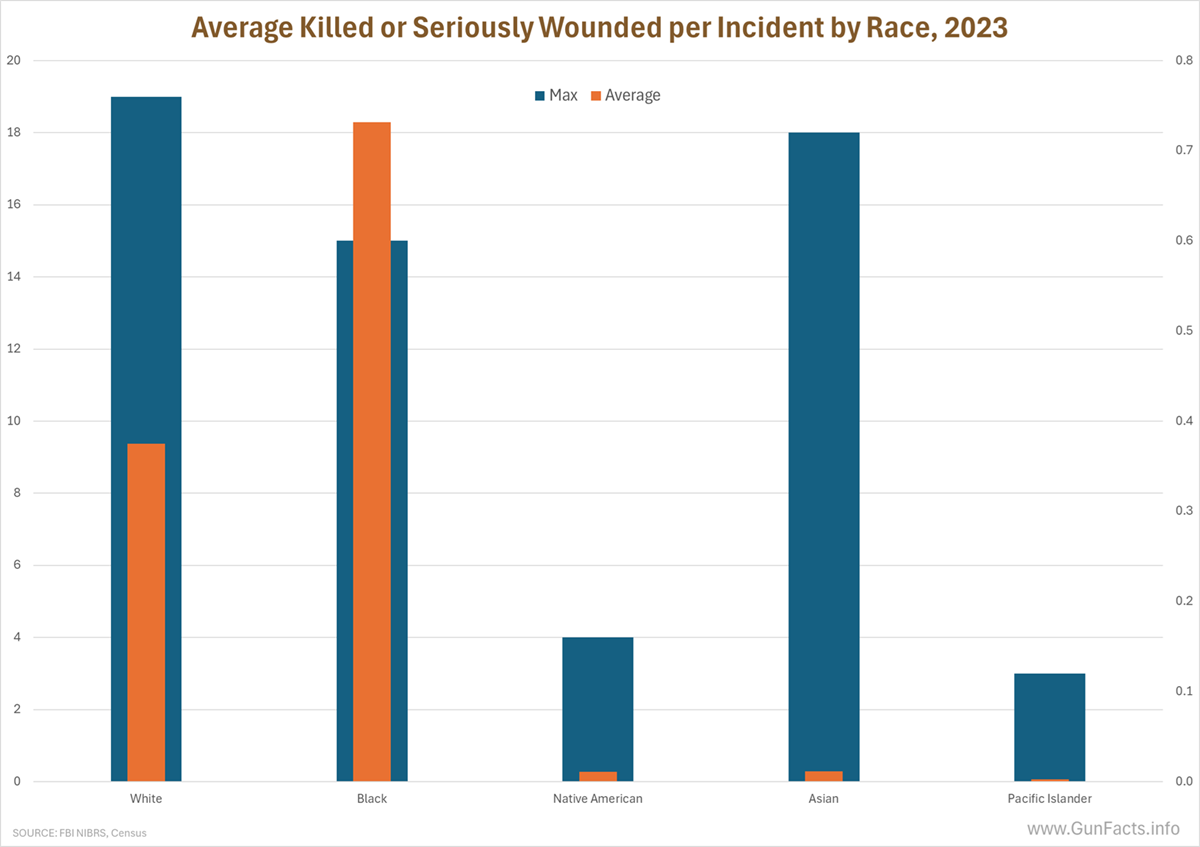
We had noticed an increasing rate of “dueling confrontation shootings” in metro areas, where two or more people started arguing in a very public setting and then exchanged gun fire. Innocent bystanders are killed or injured.
We see in the data that the maximum number of people killed or seriously injured in violent gun crimes varies a little among races that are a significant part of the population (counts for native Americans and Pacific Islanders are low in large part to their low population totals). But the divergence between whites, blacks and Asians is of interest. The average number of people killed or injured in any event is nearly twice as much for blacks as for whites, but almost non-existent for Asians.
We know from the National Gang Center that blacks are over-represented in street gangs, and the anecdotal evidences cited above, which may be manifestations of gang culture, could explain the increaed death/injury rates for violent gun crimes with blacks.
Injury Types From Gun Violence
Speaking of injuries, they are not the same and are not the same for each type of crime. For example, only 14% of aggravated assaults where a gun was involved cause serious injuries 3
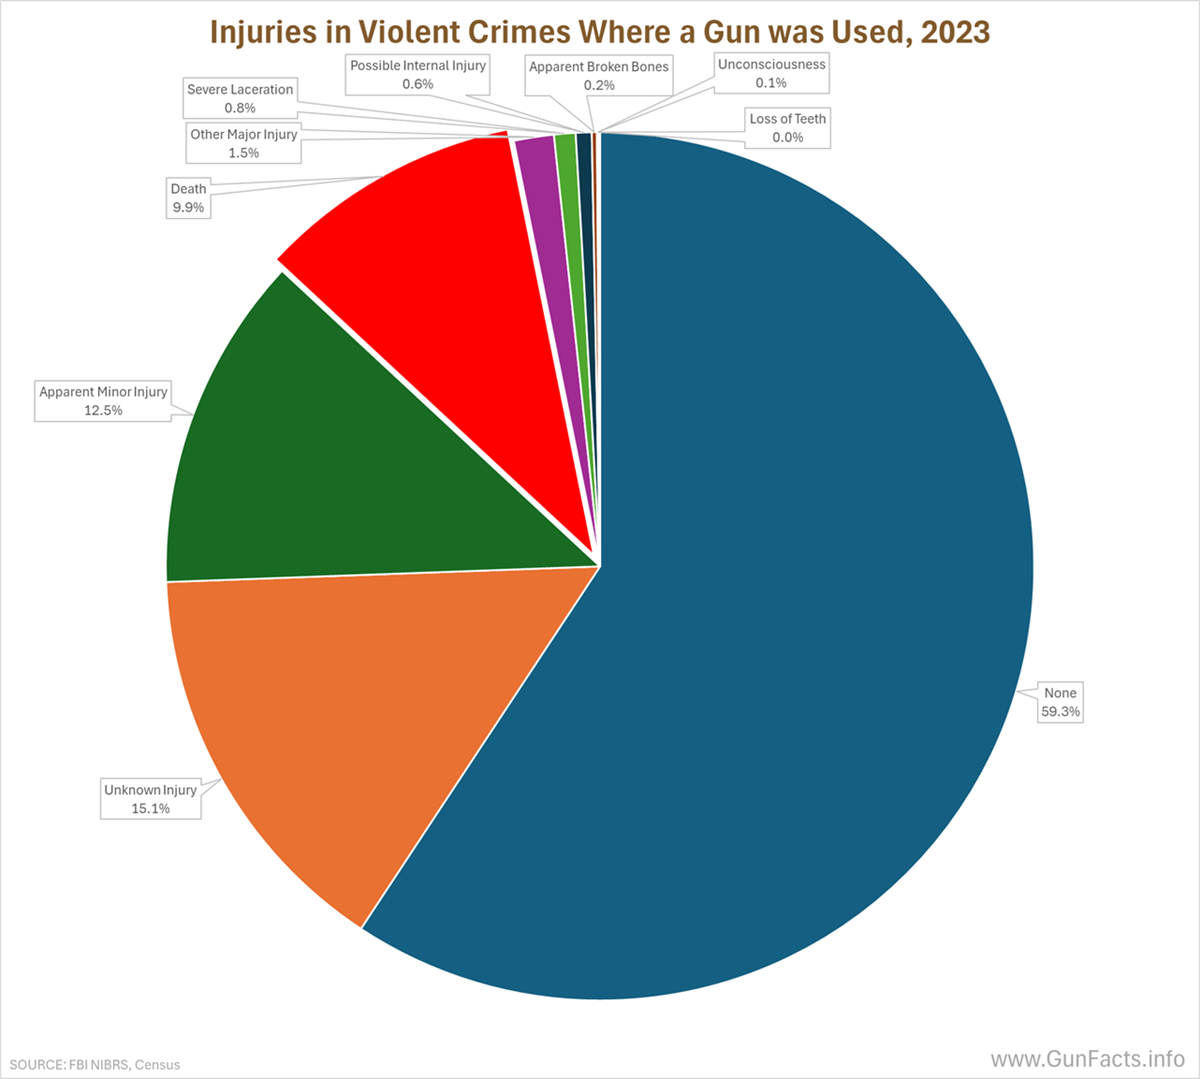 Where a gun is involved, nearly 60% of the time there are no injuries at all. But that is mainly because robberies (income-producing activities) and aggravated assaults (spontaneous hot-head crimes) might only involve brandishing a gun.
Going around the pie chart we see that some injuries were not even classified, and we at Gun Facts suspect they were so minor they did not warrant investigators classifying them. We have to roll past “minor injuries” to see that less than 10% of violent crimes involving guns resulted in death. Crime, violence, and guns in crime are still a problem, but the relative rate of death to non-injuries or just minor injuries is stark.
How stark? Of violent crimes involving a gun:
- None and minor injuries: 87%
- Death: 10%
- Serious injuries: 3%
Catching Criminals
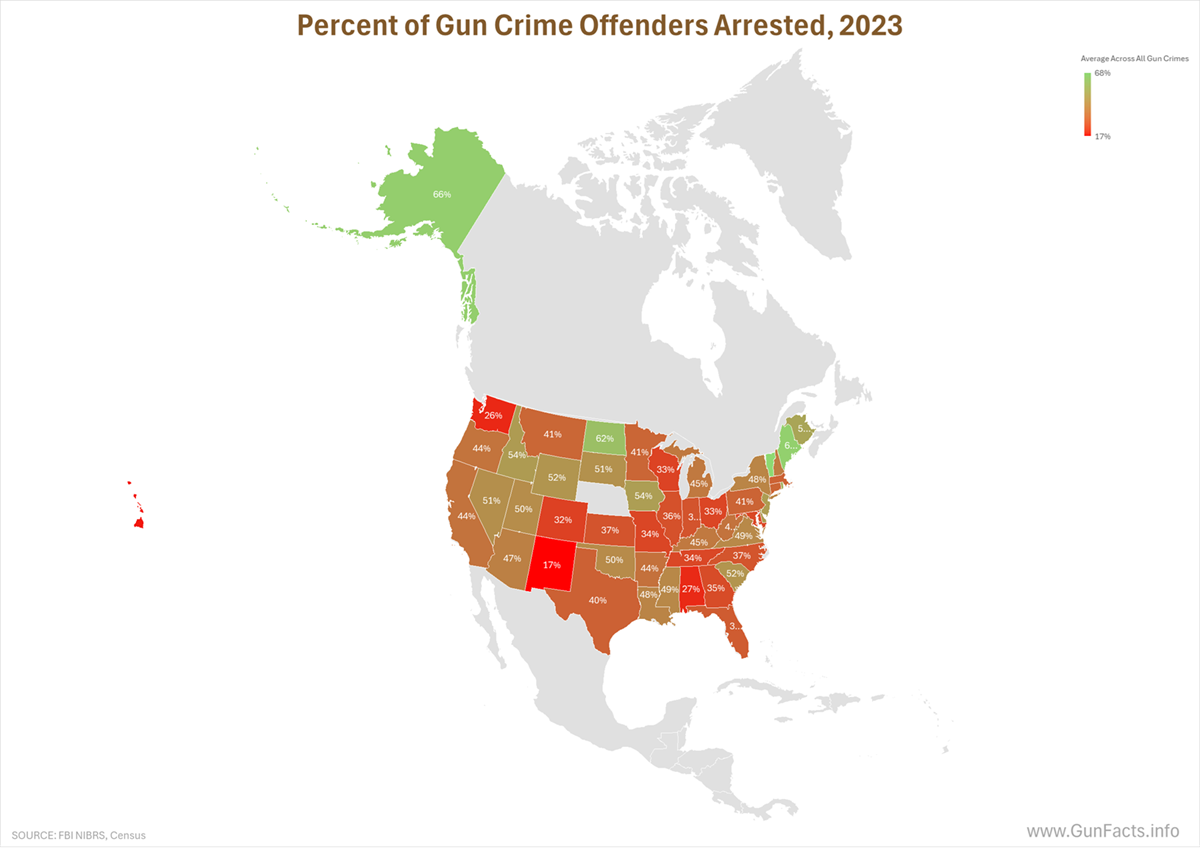
As a country, we don’t do a great job in catching gun crime perpetrators, though the degree is highly variable between the states.
Nationally, only 40% of offenders who committed crimes with guns are arrested in the same year. In some ways, this is understandable. Criminals strive to avoid it. Witnesses are often unwilling to cooperate or are unreliable. And police staffing is not robust. In short, a lot of gun-using criminals get away with it.
The arrest rate varies highly with both the state (and locality, though we are not digging that deep in this study) and the type of crime in which guns are involved.
 |
 |
 |
 |
Vermont is the most successful with 68% of their gun-using perps being arrested. But Vermont is cold and sparsely populated compared to many states, and the people are nearly Canadian in their politeness. These factors matter.
On the opposite end is Washington, DC with an abysmal 18% of perps being caught, which helps explain why the seat of the federal government is routinely the murder capital of the country. But they are slightly better than New Mexico at 17%.
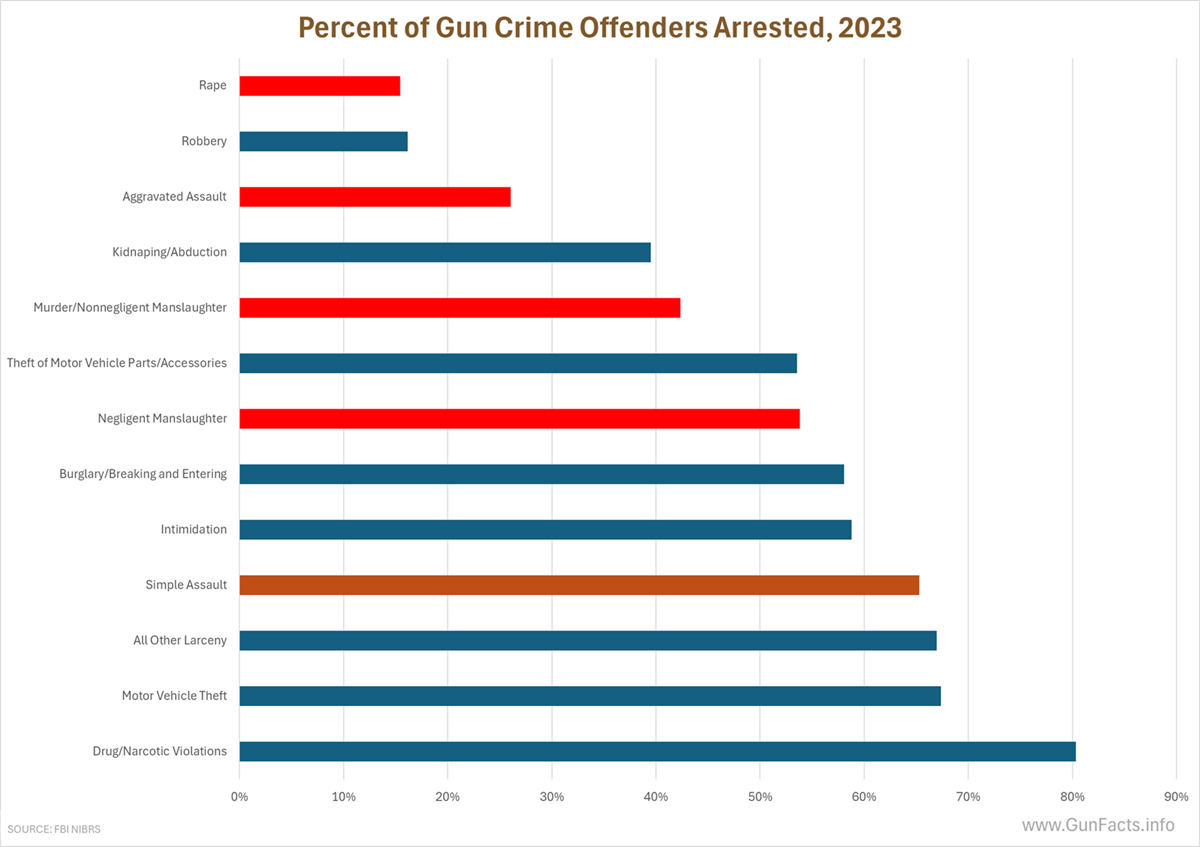
More disheartening is that the forms of direct violence against a person are where we make the fewest arrests.
Rape could be discounted since guns are very rarely used to commit rape (perps mainly rely on brute force and knives). Yes, aggravated assaults, murder, and negligent homicides result in far fewer arrests than drug running and carjacking.
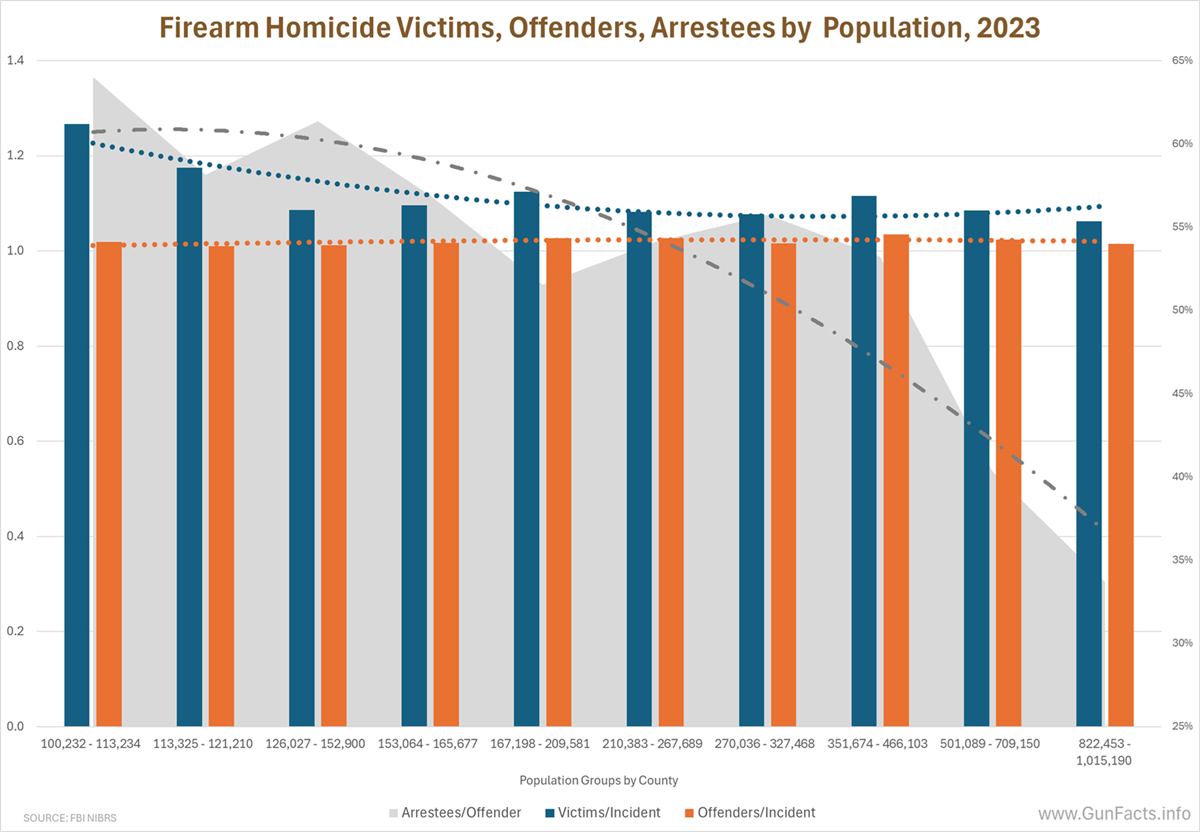
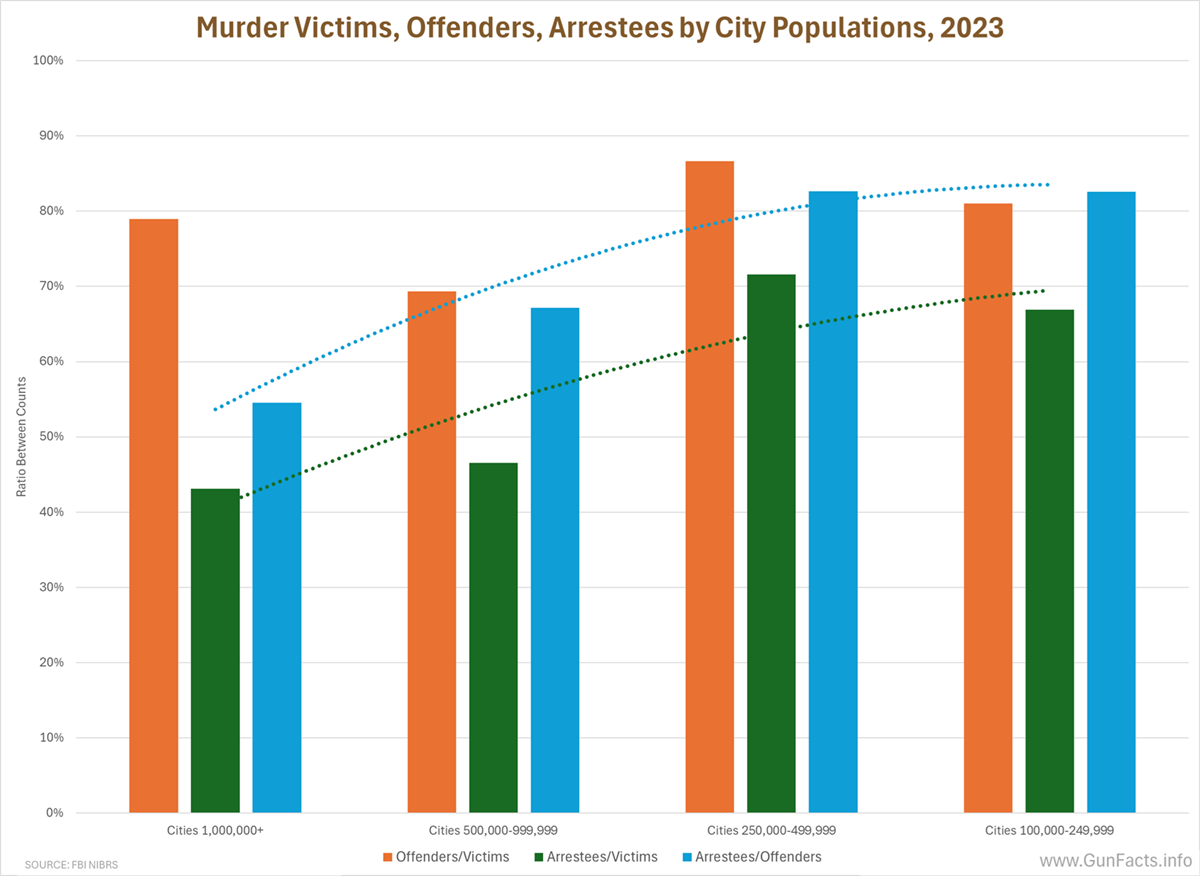
Most concerning, though, is the “big city” issue. It is well understood that counties with large metro cities rank higher for gun crimes. As we showed in our Top 15 Murder County study, some of these metro areas have both high street gang activity and lower police staffing. This is a uniquely dangerous combo.
Interestingly, the rate of murder or non-negligent homicide victims for each incident where anyone dies from guns (sans suicides) is higher in smaller population counties. And the number of offenders per incident rises slightly with the population, a trademark of gang conflict shootings. But the rate of arrestees for reported offenders drops off sharply in highest population counties. In short, more gangs, more offenders, fewer arrests.
Multiple Perps
We have noticed recurring events where two or more people start shooting at one another in public. We also know from old literature that some career criminality can involve “partners” toting guns.
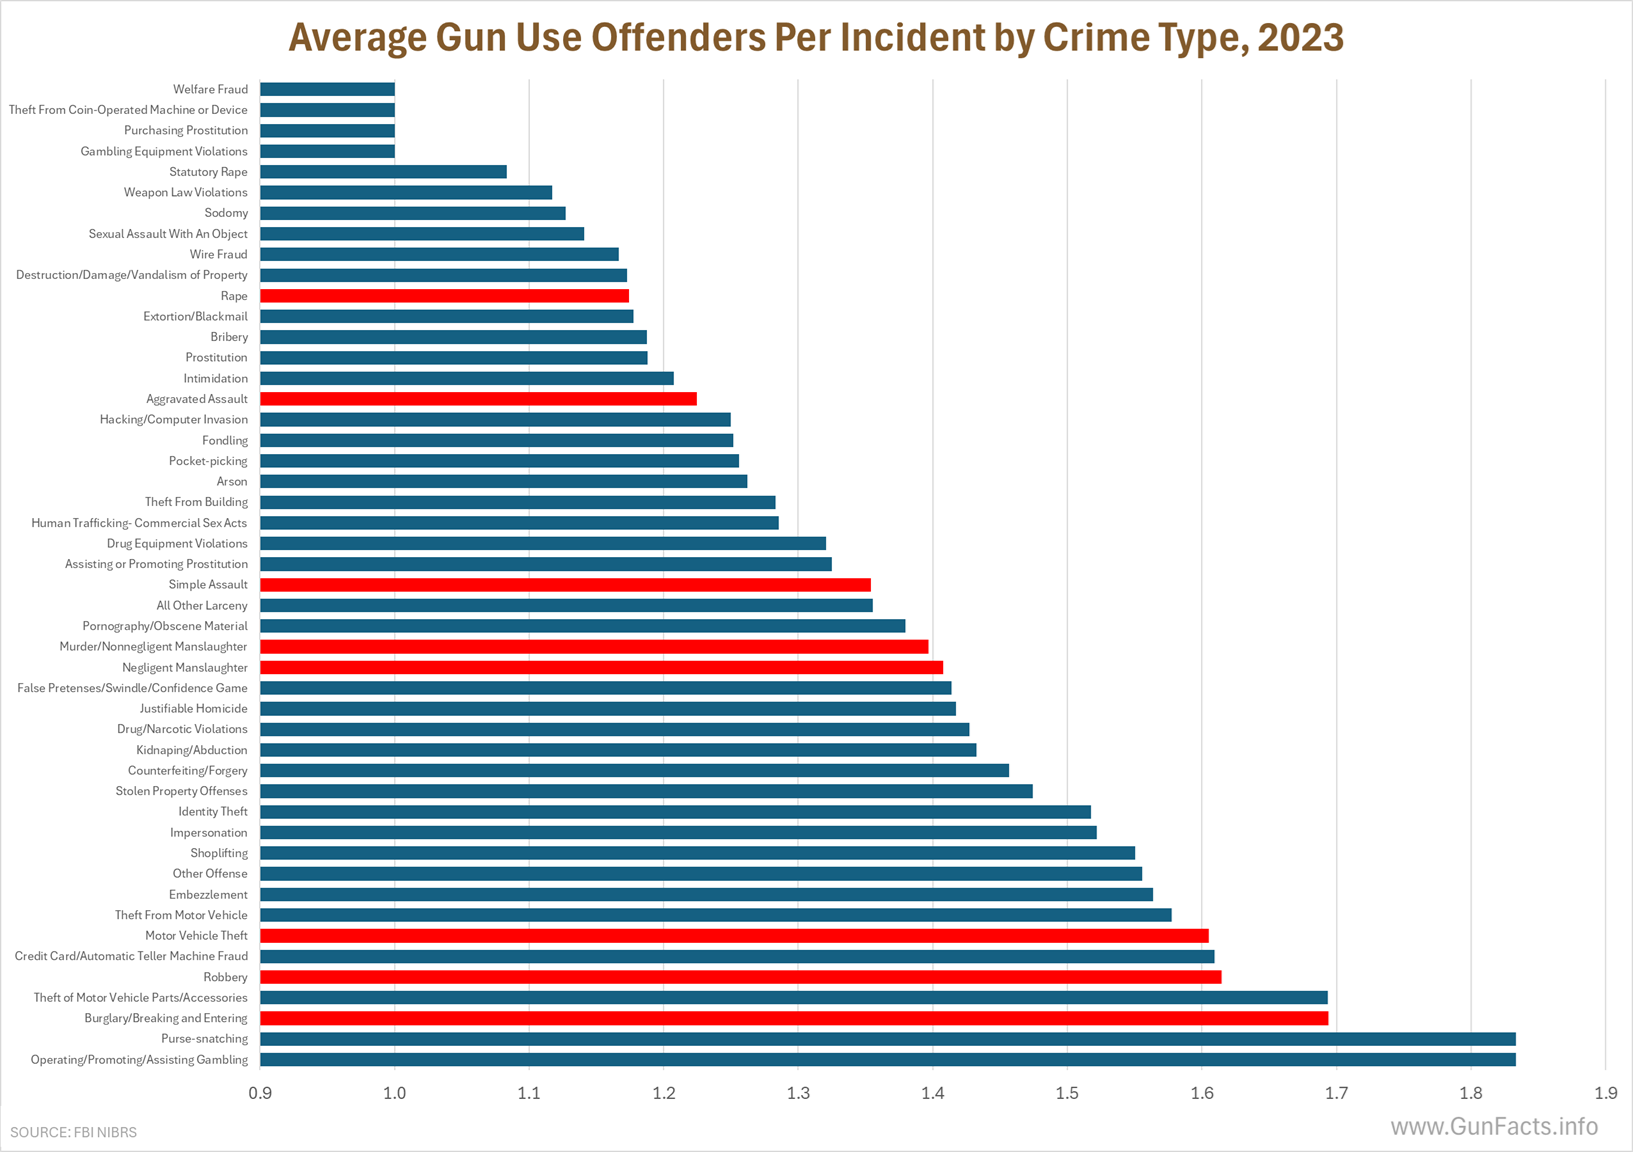
When we look at the average number of armed perps for various types of crimes, we see things expected and not expected.
Crime types with higher average perpetrator counts include the expected: robberies (two dudes hold up a liquor store), vehicle theft (think carjacking). Others are seemingly odd, including gambling crimes, purse-snatching, and ATM fraud (we omitted from the chart “betting/wagering” which averaged four perps per instance).
Halfway down the list came murder and negligent manslaughter. These make sense inasmuch as most instances are unilateral violence, not a team sport. But still, these had an average of 1.4 perpetrators.
Race and Arrests
We at Gun Facts hate discussing race. Our conclusion is that there is no biological determinism connecting race to violence.
But numbers don’t lie, and there are disproportionate violence and responses to violence between races. We have covered this quite a bit, so in this study we aren’t going to explore the degrees of violence by race.
We will, however, explore how law enforcement responds after violence is committed.
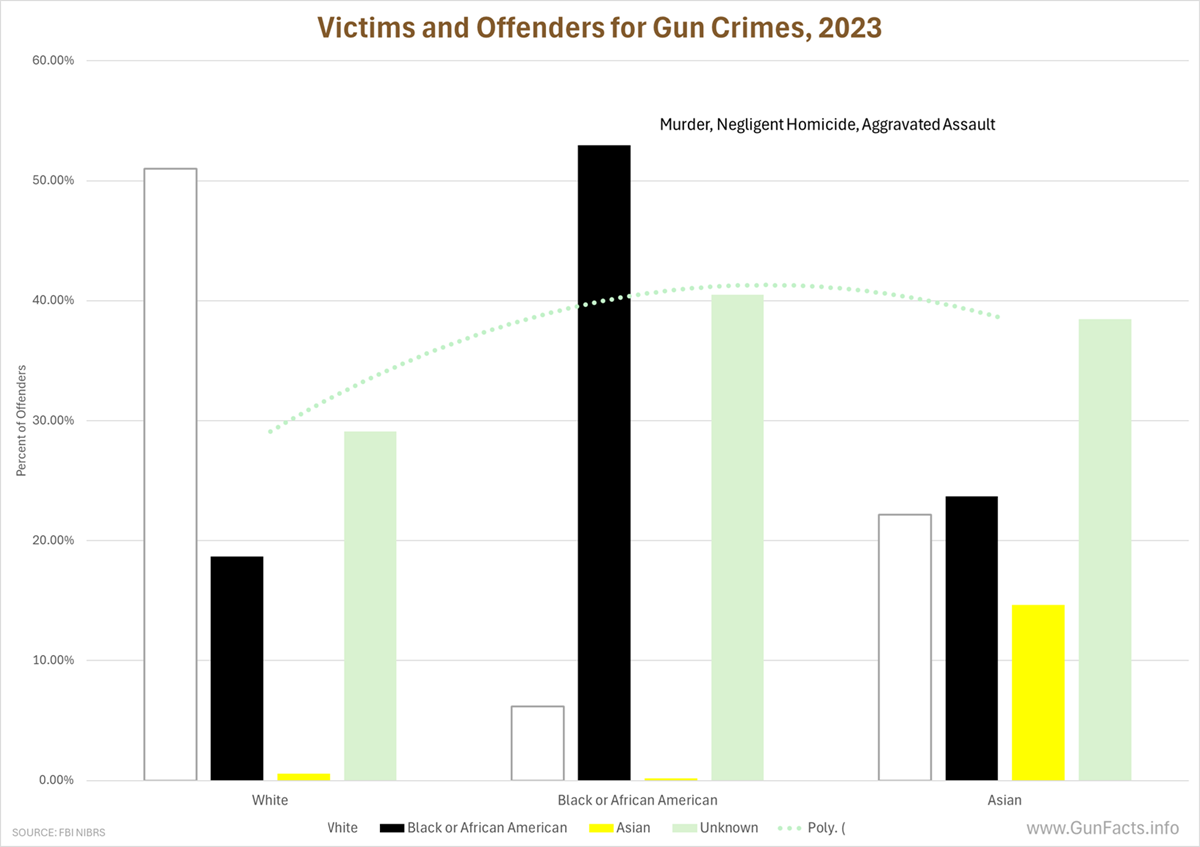 One thing to understand is that, by and large, people kill within their own race, their own age groups, and their own geographies. Hence, a simple review of gun violence chaining the number of reported offenders of the same race, and then the number of arrestees of the same race, gives us an idea of disparities in how effective law enforcement may be.
Several things are worth noting. Among whites, the number of reported offenders who were white is low. There are several reasons for this, the main one being that as the majority race in the United States, the raw probability of being a victim of any crime is higher for whites. This includes violent encounters (i.e., aggravated assaults) with non-whites.
But notice that the rate of arrests of white offenders is higher than that for black victims of black offenders. There are many reasons that have been proffered over the decades for this, including:
- Different cooperation rates for different races
- Geographic economic differences for races, allowing some regions/races to have better police departments
- “Localized justice” in some communities where the police and courts are not trusted, and retaliatory actions are condoned (which compounds the problem)
We at Gun Facts don’t have hard statistical data these assumptions, but anecdotal evidence and conversations we have had with investigators lead us to believe these are relevant factors.
Where Gun Violence Occurs
Since we know from stats and criminology literature that most street gang violence occurs in public, and since one of the major predictors of street gang participation is race (along with age and urbanicity), where gun violence occurs is something worth exploring.
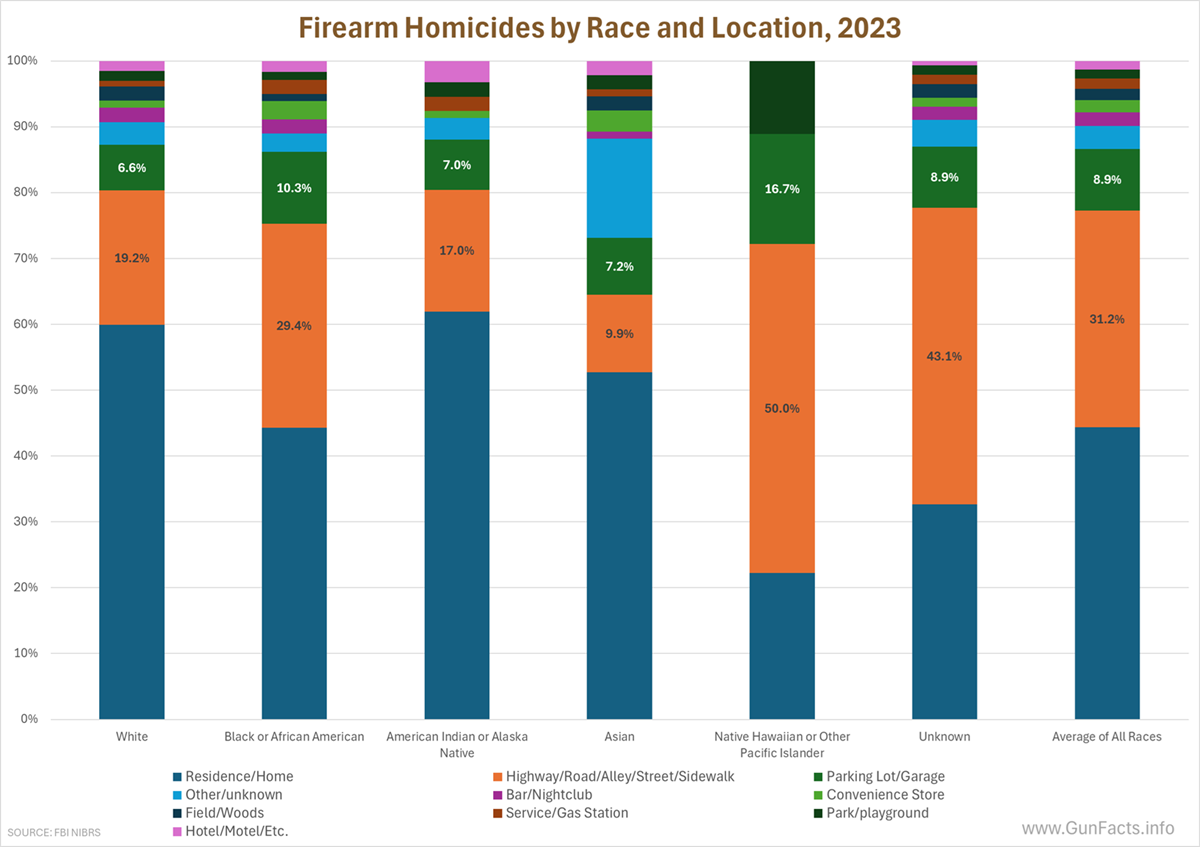 Ignore (if you can) the high rates of public gun play for Hawaiians and Pacific Islanders. They are a tiny fraction (0.2%) of the population, and thus any small number of incidents of gun violence could heavily skew the rate of violence, including where the violence occurs. We also have to gulp hard when noting that over half of gun murders and non-negligent homicides where the perpetrator is unknown (no witnesses or silent ones) occur in public places, which combined might indicate they are of gang culture circumstances.
Next, we start to see divisions. For whites, 26% of their gun murders occur in the top two public places (Highway/Road/Alley/Street/Sidewalk and Parking Lot/Garage) while for blacks it is 40%. Excluding the Hawaiian/Pacific-Islander outlier, blacks kill in public at nearly twice the rate than other races (40% versus an average of 22% for all non-outlier races).
Where Gun Crimes Go Unresolved
In our big study concerning the Top 15 Murder Counties, we noted that the worst places for gun murders were major metropolitan cities with low police staffing and high street gang activity.
 This is shown more clearly when we look at the shortfalls for offenders being described to investigators, and between the number of offenders described and the subsequent number of arrests.
America’s largest cities have the worst record in terms of offenders being documented by police and for arrests per number of offenders. This might be caused by a number of factors, the most important likely being:
- Understaffing of police departments, which not only reduces street-level deterrence but also implies a department-wide inability to investigate and make arrests.
- Subcultures in metro areas where no-snitching rules and high street gang activity rates impede what few investigative hours are made.
Age and Location Matter
Where a gun crime occurs, and what type of crime it is, exposes some of the age elements we see in the data elsewhere.
We know from other research that most street gang violence occurs, well, on the streets. This is fairly clear on this chart. Street homicides rise more sharply in the active gang ages (ages 14 through 22). Once middle age is achieved, street homicides are well below total homicides in terms of curve chapes.
A deeper look helps confirm this. Between public and private locations and some types of personal violence, there are many “hot spots” (bold, red numbers). The age of gun violence victims are the mode (the peak of the curve for each crime/location combination). 4
The point herein is that location is different for different types of crime, different age groups and different motives. A street gang member hunting rival gang members will prey on the streets, whereas a robber will not.
Motive Matters Too
Why people commit gun violence is significant. After all, if you have no motivation to point a gun at someone, you won’t.
 |
 |
 |
 |
 |
 |
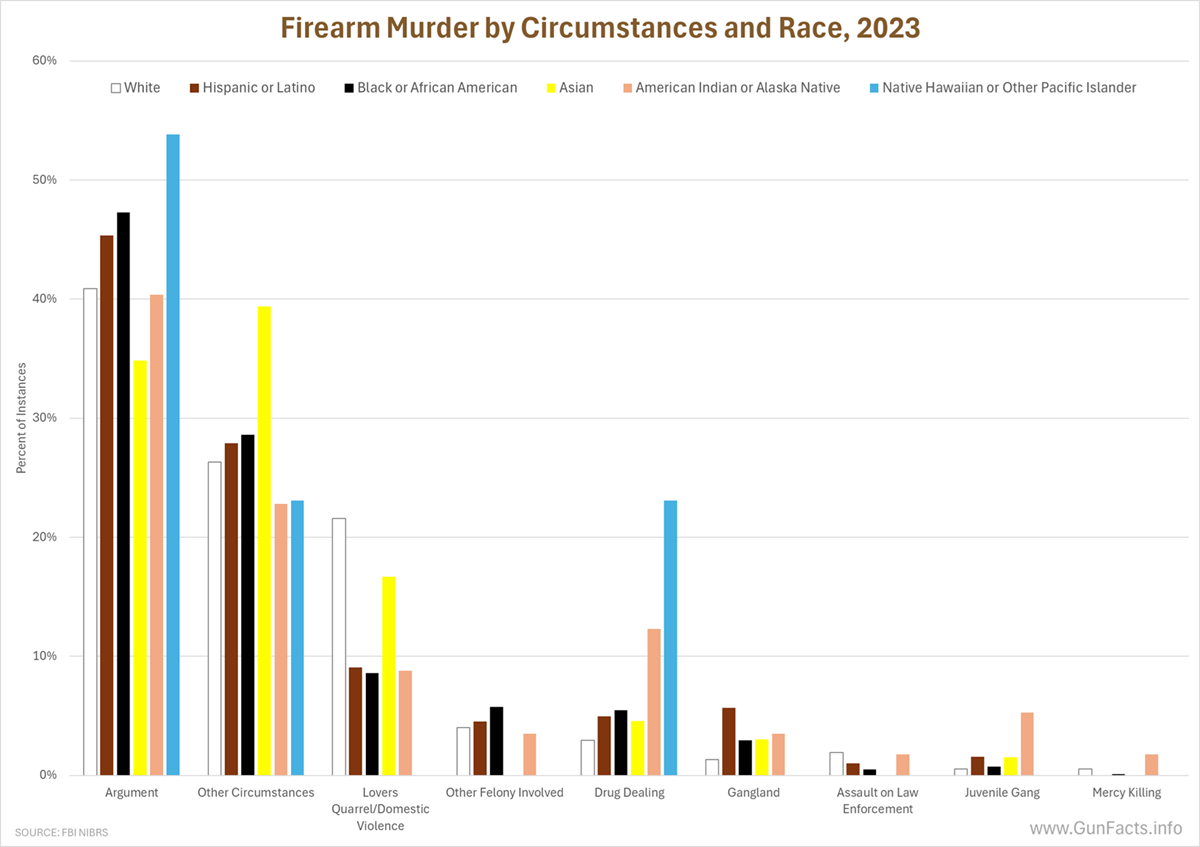
The bad news is that only 52% of gun homicides have known “circumstances,” the FBI’s term for “what started it.” Compare that with the lackluster case clearance rates (mainly in major metropolitan areas) and you see enough covariance to again lay blame on insufficient police staffing.
For gun homicides, there is a bit of difference. Though no race is immune to arguments leading to murders, there is a steady escalation in the rate of these circumstances from whites, through Hispanics and to blacks. However, whites are much more prone to lovers’ quarrels and domestic disputes getting out of control.
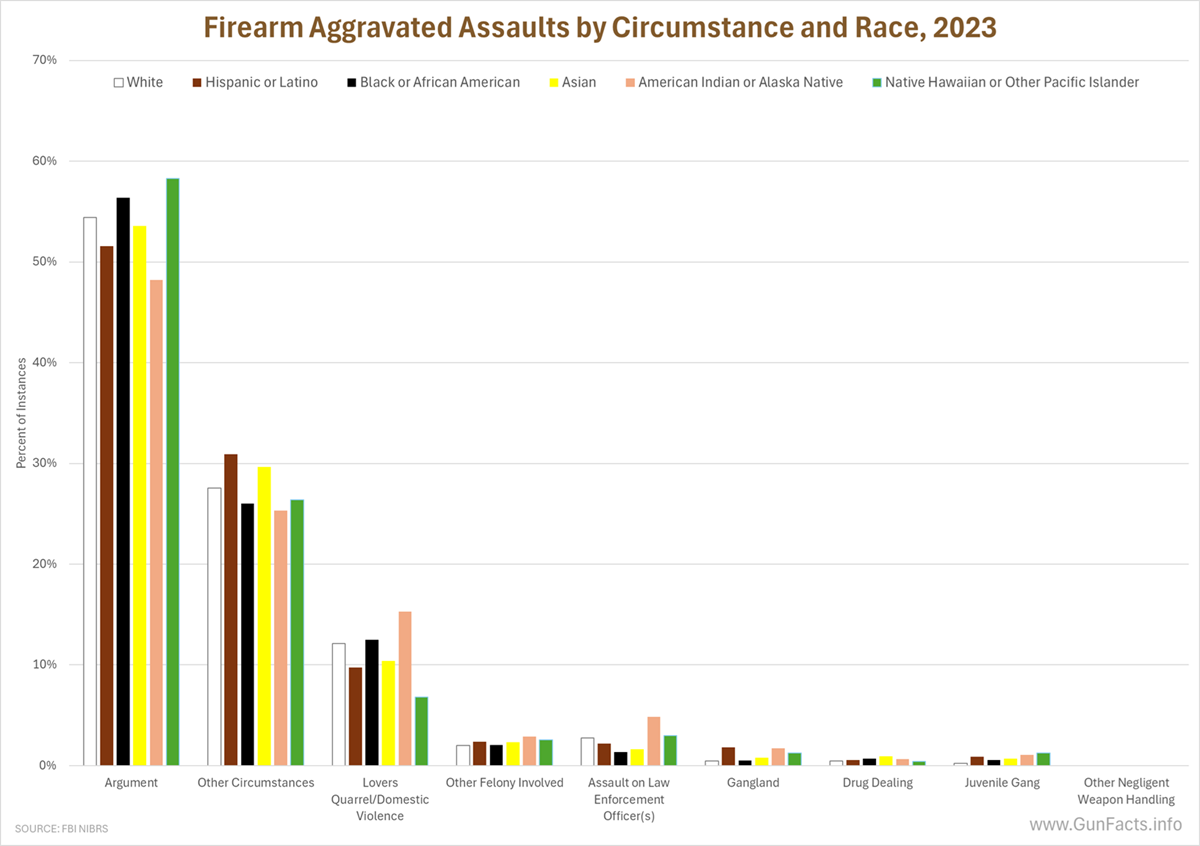
Interestingly, the rates level out substantially for races when we look at aggravated assaults involving a firearm.
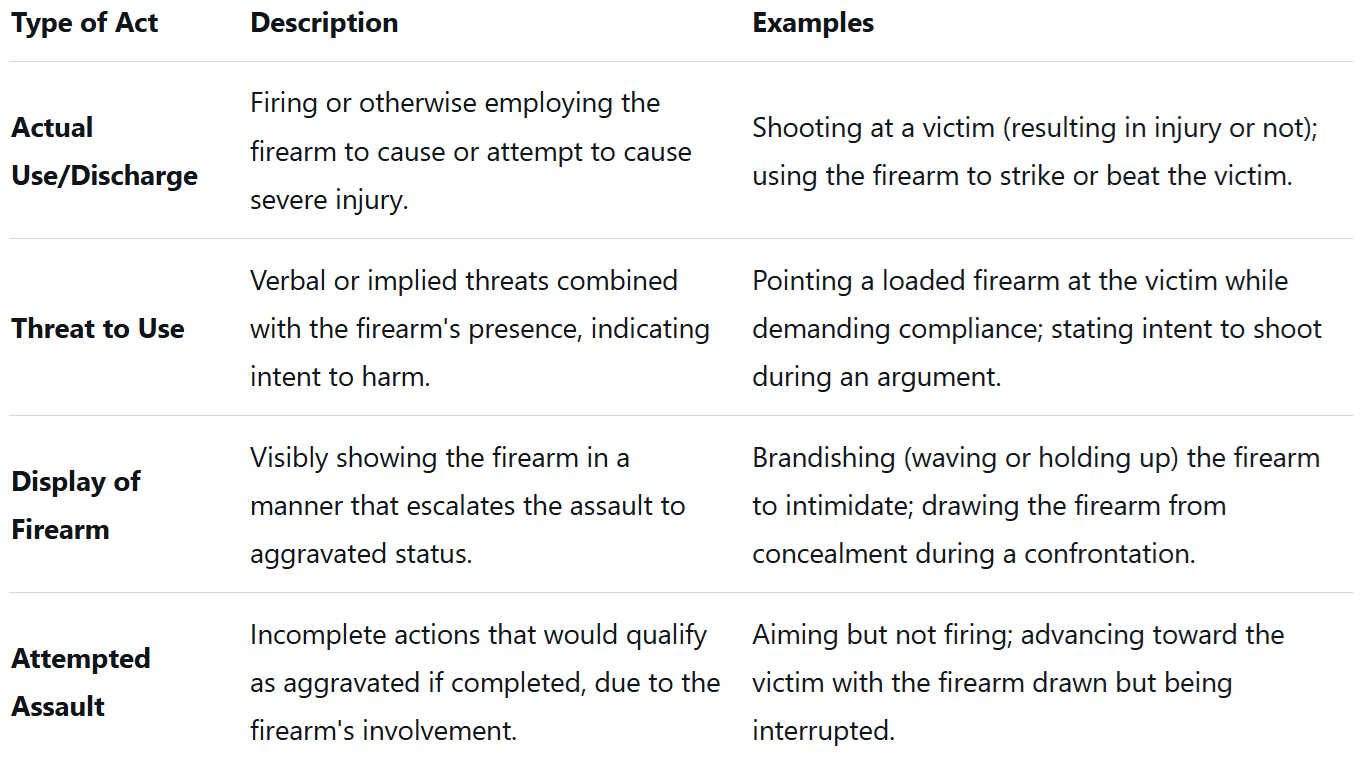
There is plenty of explanation for this because the FBI’s definition for aggravated assault using a firearm is broad:
- An unlawful attack by one person upon another for the purpose of inflicting severe or aggravated bodily injury
- Includes all assaults (or attempted assaults) in which a firearm of any type is used or threatened to be used
- Not limited to actual discharge but extends to preparatory or threatening behaviors
Since merely intimidating someone with a gun and not discharging it is included, we have a wide range of motives and cultural constraints at play that would be less prevalent when someone actually pulls the trigger with intent to kill.
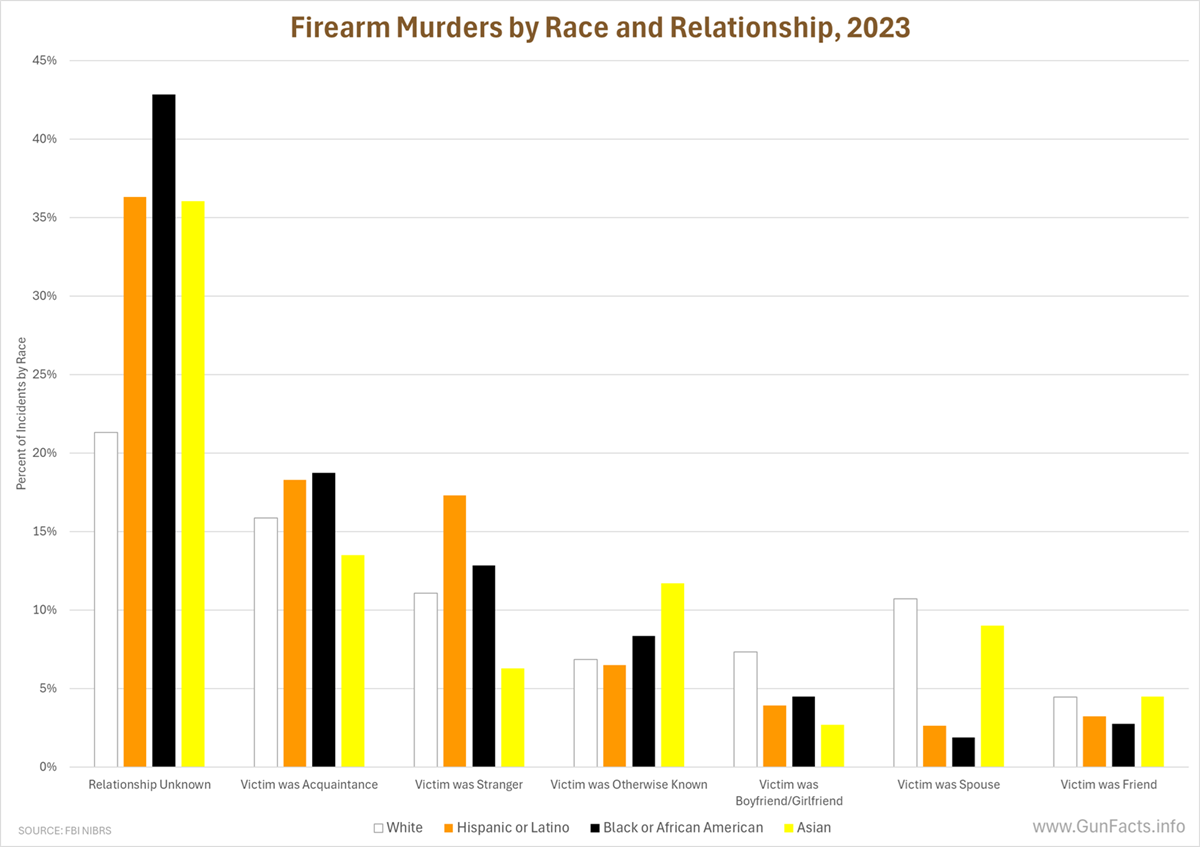
Who Knows Who
The relationship between the offender and victim of a gun crime can be compelling, Remember above that whites were more prone to gun homicides of intimate partners than other races. Also recall that offenders in gang offenses, statistically skewed by both race and age, are often unknown. It is worth having a quick glance at the data to see if there is a meaningful divergence.
With race we see some compelling drift. Most obvious is that the race of the offender in gun murders is twice that for blacks than whites. But all non-white races were also higher, with native Hawaiians and other Pacific islanders being off the charts (though they are such a small portion of the population, this is a data anomaly). However, for whites, boy/girlfriends and spouses are the victims much more often.
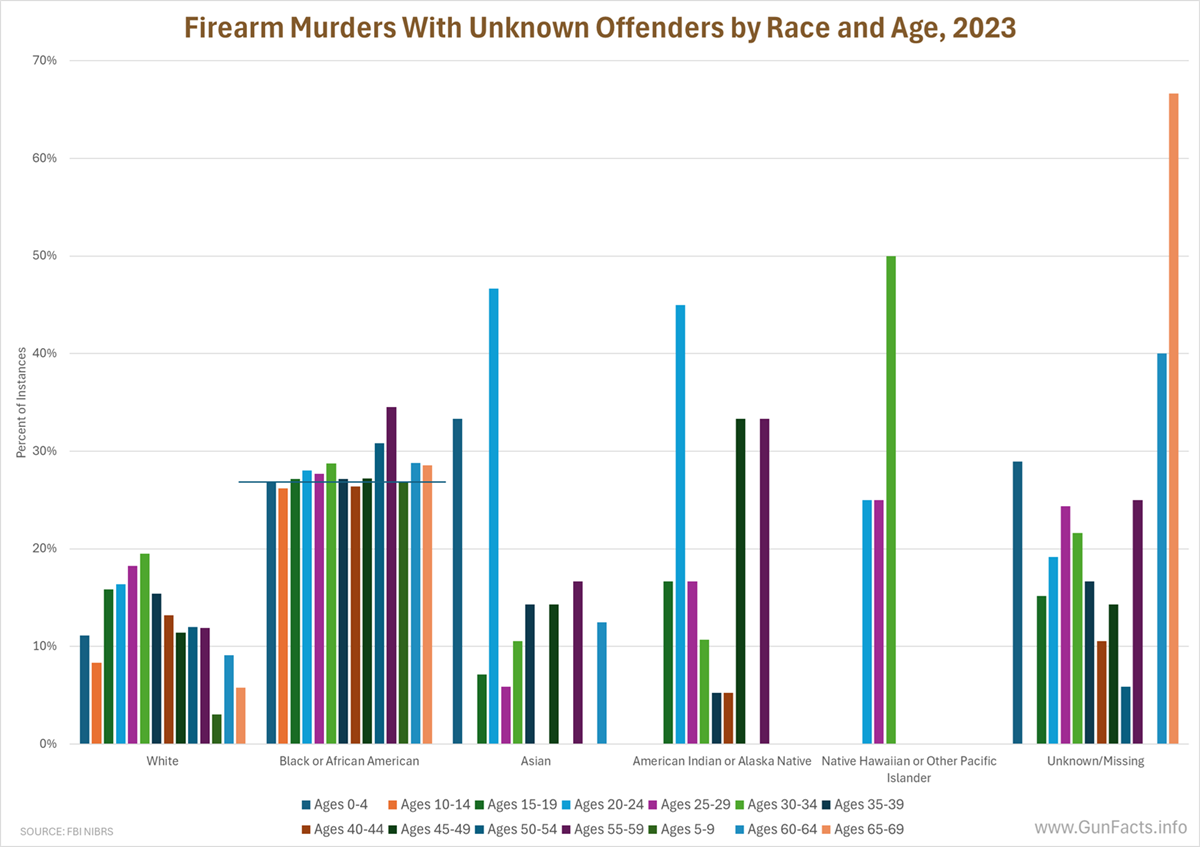
Who Is Unknown
American inner cities are problematic due to community-level cultures.
Many have commented that the following cultural attitudes appear in some very rough neighborhoods: 5
- High violence rates, including retaliatory violence
- Distrust of police and courts
- General lack of trust within the neighborhood
Combined, these lead to more murders (using guns) and less cooperation with police.
What is interesting is the unexpected uniformity in the percent of gun murders among blacks regardless of their age. We could have anticipated a spike in the heavy street gang activity years, but that is not the case. Across all ages, lack of cooperation with authorities (the “no snitching” culture) leads to uniformly higher instances of murdered victims and no identifiable offenders (the cops have no description, much less a name).
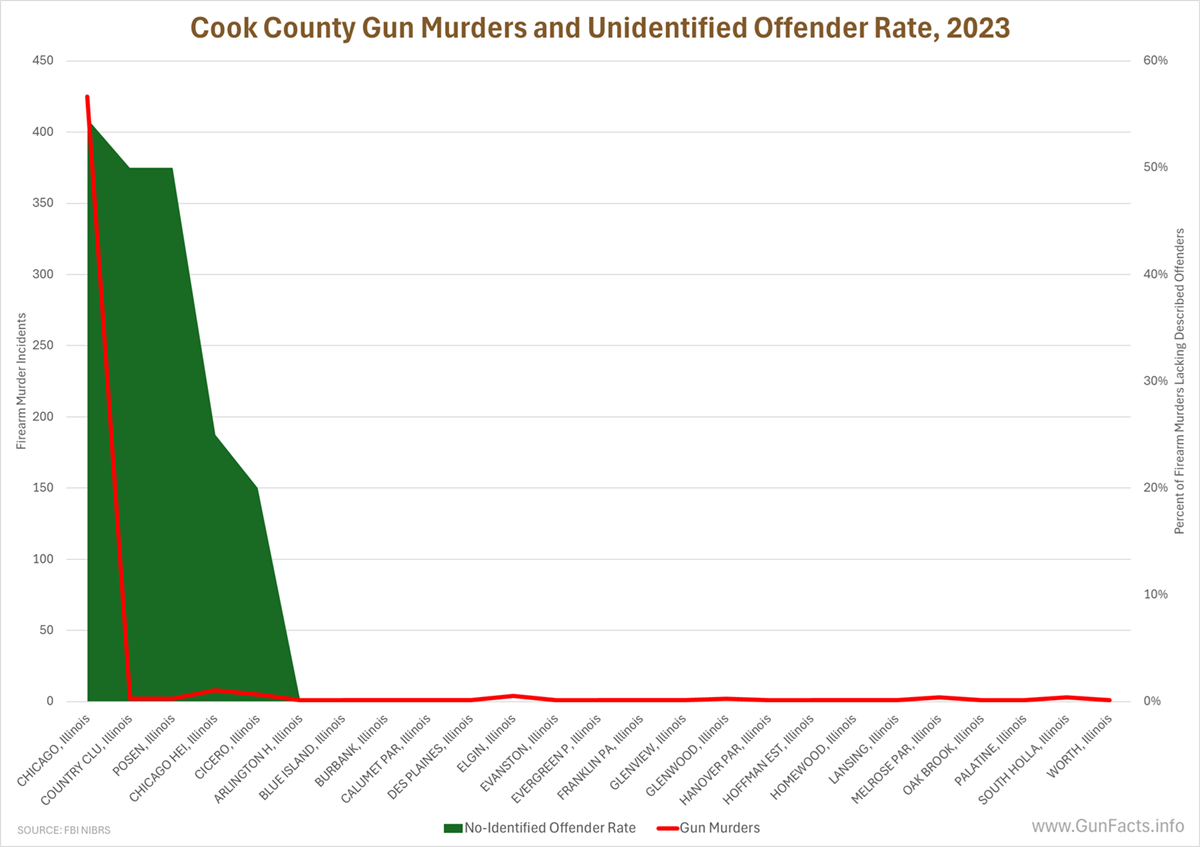
More interesting and also more expected is how geography plays into the problem.
Let’s pick on Cook County, Illinois, which took the top spot in our 15 Top Murder Counties study.
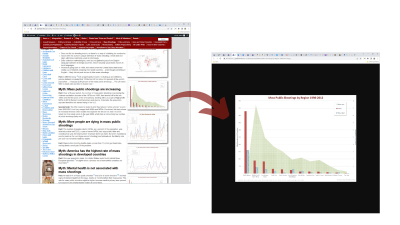
Among the cities in Cook County, 75% had no gun homicides and 17% had only one. This chart shows those that had gun homicides (aside from three cities that had only one, but also had no identified offenders, and thus presented a misrepresentation of 100% failure rates for documenting offenders).
Chicago landed atop the Top 15 list because they have both an elevated street gang problem and an understaffed police department. They provide 3.3 duty officers for every 1,000 citizens. Among the other “hot” counties, the rate is 4.9 officers. The chart shows how understaffing creates two problems: lack of deterrence of street violence, and the inability to identify those who commit it. Chicago’s homicide clearance rate is only 35% compared to a national average of 68%. Recent news reports claim that 35% is high due to the city’s police department misclassifying case clearances.
Some Grumpy Notes About FBI Data
I won’t criticize the FBI (too) much. Data gathering and management is a big and thankless job.
And when big changes are necessary, it gets harder and more prone to public discontent.
 But I think the FBI missed an opportunity and I want them to consider a correction.
When the FBI designed the new National Incident-Based Reporting System (NIBRS) to replace the venerable but scant-on-details Uniform Crime Reporting (UCR) system, they added a lot of new data, which put twisted smiles on faces of data monkeys like me. I might quibble on the data design (not “normalized” in the structured query language sense), but it is a delight to have data that simply was unavailable before.
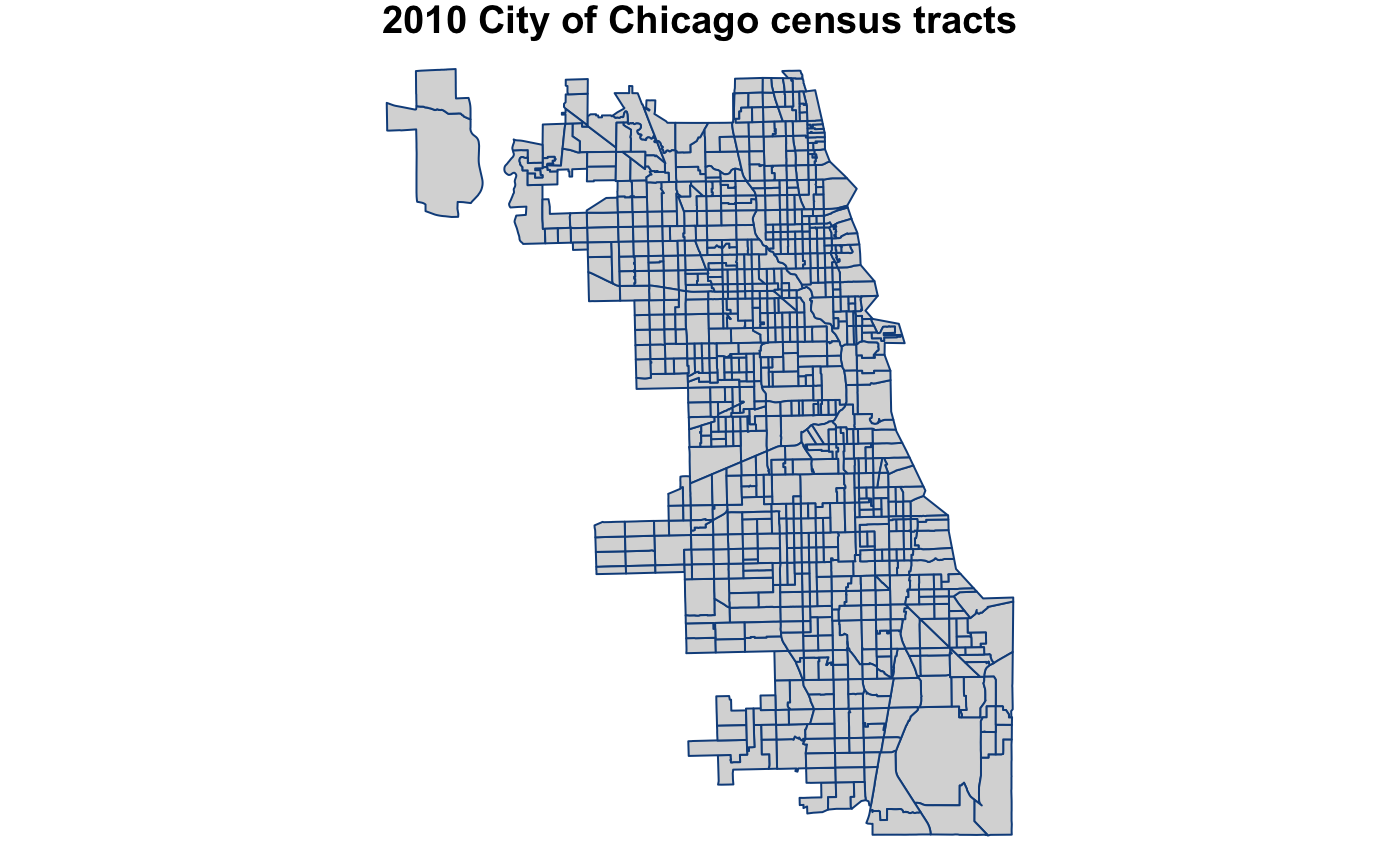
Yet… census tracks.
The map of Chicago you see here is their census tract map. Had the FBI included one more data field to the crime tracking system, we analysts could have gotten hyper-granular in our analysis. Recall that Cook County (Chicago) is atop the list of most murderous cities when it comes to guns. Had the FBI included the census track variable, we could dive into any county down to the neighborhood level and explore the published demographics, sociographics, and more along with their gun crime rates.
The FBI can add this, but given that they are still waiting for some agencies to even start logging NIBRS data, they might not see it as a priority.
The State of Gun Violence
What this audit shows is what we have known before, but with greater clarity.
- Gun violence is highly concentrated.
- Most gun violence isn’t deadly, since it is associated with criminal enterprise.
- “Where” and “who” matter most in predicting gun violence.
- Stay out of Chicago.
Notes:
- Unlawful attack intended to inflict severe or aggravated bodily injury ↩
- physical attack where no weapon is displayed and the victim does not suffer “obvious severe or aggravated” injury ↩
- Do understand that if someone dies, the crime then is classified as a homicide. ↩
- We show a subset of all crime and location types, prioritizing the ones that were most personal or frequent, so it would fit on your computer screen. ↩
- Gotta Make Your Own Heaven; Swaner, White, Martinez, Camacho, Spate, Alexander, Webb, Evans; Center for Court Innovation; August 2020 ↩
What I am seeing form the charts is that “justifiable homicide” is the most common use of a firearm.
That tells me that people are protecting themselves, and others, more often than crimes are committed with firearms.
No. It means that 90%+ of the time someone commits a justifiable homicide, a gun is used.