Sorting out definitions
Regrettably, people have devised many different definitions for words describing mass murder. This has created great confusion.
Below is a list of commonly used terms with notes about which ones you might want to use or avoid:
| TERM | Definition | Includes | Source of Definition | Used By | Notes |
| Mass Public Shooting |
|
Only killed | Criminologists 1 |
· Most criminologists · Gun Facts · Mother Jones 2 · Violence Project |
A 2012 definition created by Congress uses 3+ victims as their definition. But this definition is not widely used or respected. 3 |
| Mass Shooting v1 |
|
Killed or wounded |
Everytown
Gun Violence Archive |
Everytown
Gun Violence Archive |
Everytown admits on their web site that they adopted a new and unique definition, discarding the traditional criminology one. |
| Mass Shooting v2 |
|
Killed or wounded | Mass Shooting Tracker | Mass Shooting Tracker | |
| Mass Killing |
|
Killed only | Associated Press | Associated Press | |
| Active Shooter Event |
|
Killed or wounded | Adopted by the FBI, sourced from School of Criminal Justice, Texas State University | FBI, academia | FBI |
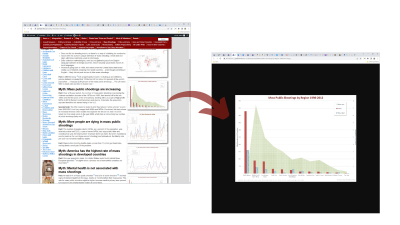
MPS portion of all firearm homicides, USA

click to enlarge
Though the average number of people killed in MPS events is rising slightly, it is the falling overall rate of gun homicides that makes the percent of MPS deaths artificially high.
Note that in the worst year on record (2017, Las Vegas country music shooting and the Sutherland Springs church shooting), the percent of deaths from MPS was 0.67%. In an average year excluding 2017, the rate is 0.2%).
Domestic trends

click to enlarge
The number of MPS in the United states is rising slowly, though the average number of deaths and wounded people is rising less quickly (slope of line: incidents = 0.10, death = 0.08, wounded = 0.03).
International perspective

click to enlarge
Most importantly, mass public shootings (MPS) are not an “only in America” phenomena.

click to enlarge
Nor are they only an American issue in first-world countries (chart above is for all from 1997 thru 2017). There is some distortion on the left of the chart because some nations have small populations (i.e., Norway had 5.3 million people in 2017, compared to 325 million for the US, and thus a small number of high body count events makes them look outsized).
International trends

click to enlarge
Outside of the United States, the frequency of MPS is rising faster than in the US. However, the average number of people killed per incident is rising faster domestically. The key variable that likely explains this domestic trend is that U.S. perpetrators are doing more detailed planning of their events and choosing “cattle pen scenario” venues for their attacks.

click to enlarge
The US trend is upwards, though there is a big precaution, namely a handful of “super killer” events that were well-planned cattle pen scenario MPS (i.e., Las Vegas country music, Pulse Night Club).

click to enlarge
When we remove seven (7) events where the number of people killed was 20 or more, then the curve is nearly flat.
United States Basic Percentages
Of mass public shootings from 1982 thru October 2023, the following percentages are of interest:
- Perps had a prior criminal record: 64%
- Perps had a history of violence: 52%
- Venue was a “gun free” zone: 46%
- Venue was a well-chosen “cattle pen scenario”: 36%
- Event was well planned: 33%
- Magazine <= 10 rounds used: 31%
- Magazine >=15 rounds used: 40% (includes handguns with those default capacities)
- Guns obtained illegally: 30%
- Guns used conform to the 1994 federal assault weapon ban: 21%
- Handguns, shotguns, rifles used (more than 100% as multiple guns occasionally used): 71%, 35%, 20%
- Perp showed signs of, or was diagnosed with, a mental illness: 76%
- Perp with mental illness that had received prior treatment: 47%
Notes:
- Multiple Homicide: Patterns of Serial and Mass Murder, James Alan Fox, Jack Levin, Crime and Justice, Vol. 23, 1998 ↩
- Mother Jones started their database using the standard, criminology definition. They later converted to the Congressional definition of 3+ killed. ↩
- Investigative Assistance for Violent Crimes Act of 2012 ↩