
Basic to the debates on gun control is the fact that most violent crime is committed by repeat offenders. Dealing with recidivism is key to solving violence.
- 71% of gunshot victims had previous arrest records.
- 64% had been convicted of a crime.
- Victims had an average of 11 prior arrests. 1, 2
- 63% of victims had criminal histories and 73% of that group knew their assailant (twice as often as victims without criminal histories). 3
- 74% of homicides during the commission of a felony involve guns. 4
- Only 25% of victims and 13% of perps did not show any evidence of engaging in criminal/deviant lifestyles (i.e., prior arrests, gang membership, and/or drug dealing) prior the homicide. 5
- Recidivism is exceptionally high among criminals with previous gun-related charges, 70% higher than for non-gun first offenders. 6
Most gun violence is between criminals with collateral damage. This should be the public policy focus.
Myth: Gun violence is widespread in America
 From “Assessing the interaction between offender and victim criminal lifestyles & homicide type.” |
 |
 |
 |
 |
 |
 |
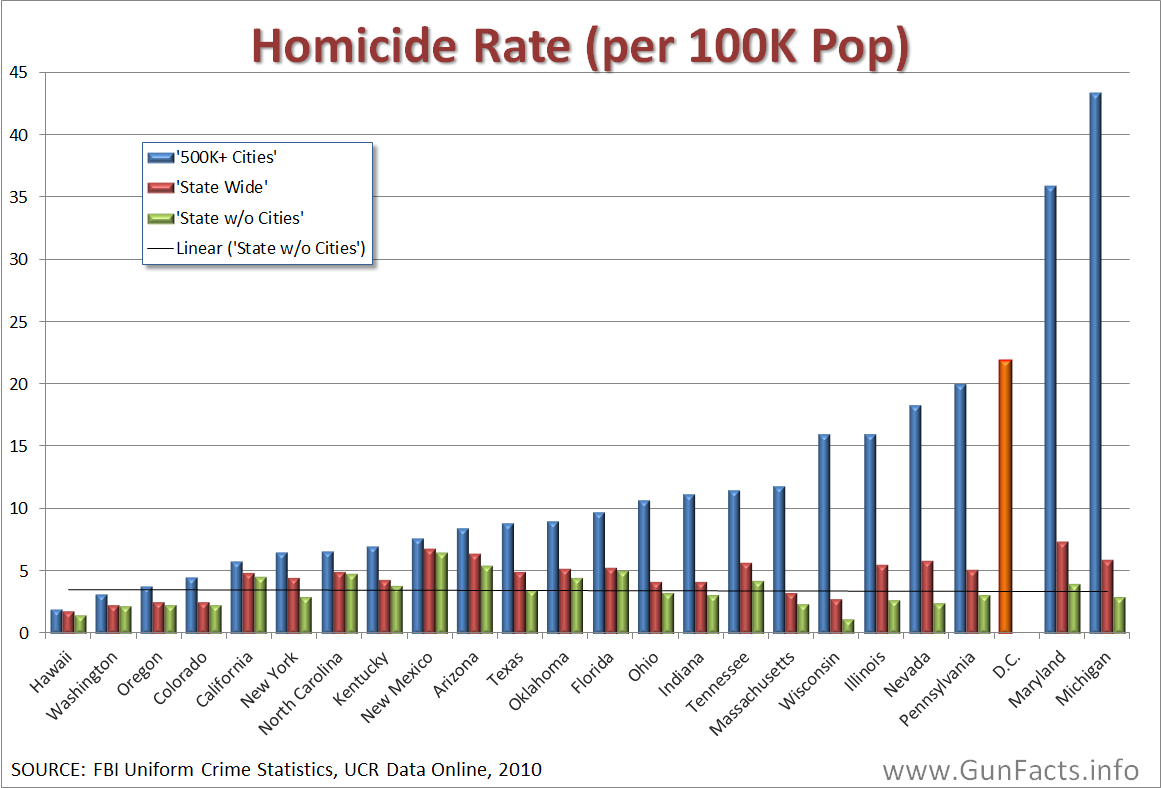
Fact: Misuse of guns is highly centralized in a few major metro areas. Fifteen out of 3,124 counties account for 25% of the gun homicides. And within these counties, violence is highly concentrated within specific neighborhoods that typically are street gang territories.
Fact: Gang related/nexus gun homicides account for 50% of all homicides when estimated from police reports 7 and upwards of 85% when estimated from street gang demographics and CDC mortality data.
Fact: “Gang homicides are more likely to occur in public settings, to involve a firearm … domestic homicides are more likely to occur in the residence of the victim and/or offender, are less likely to be committed with a gun.” 8
Fact: “At least 75 percent of the [homicide] victims and 87 percent of the offenders engaged in some type of criminal/deviant lifestyle.” hence, only 25% of victims and 13% of offenders did not show any evidence of engaging in criminal/deviant lifestyles prior the homicide. 9
Fact: 52% of homicide victims and 50% of offenders had a history of violent/weapons offenses and drug arrests. 10
Myth: Criminals buy guns at gun stores and gun shows
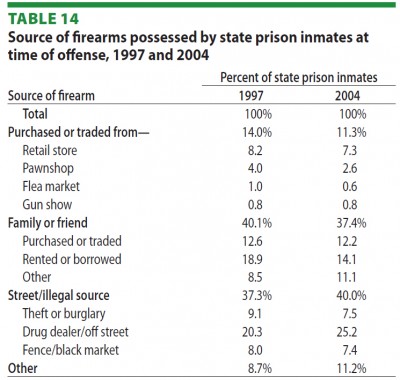
Fact: Less than 1% of crime guns are acquired at gun shows, according to the Bureau of Justice Statistics. 11
Fact: In total, about 10-11% of crime guns come from retail sources 12, where background checks are conducted. About 2.3% of guns used in violent crime come from retail sources. 13
Fact: Only 7.3% of traced guns were recovered from the individual who first bought the gun. 14
Fact: One study 15of adult offenders living in Chicago or nearby determined that criminals obtain most of their guns through their social network and personal connections. Rarely is the proximate source either direct purchase from a gun store, or even theft. This agrees with other, broader studies of incarcerated felons.
Fact: Another city-wide study, 16 this one in Pittsburgh, showed that 80% of people illegally carrying guns were prohibited from possessing guns, and that a minimum of 30% of the guns were stolen.
Fact: Other common arrangements include sharing guns and holding guns for others. 17
Myth: Crime guns come from retail
Fact: The Bureau of Justice statistics concludes that only 10% of crime guns come from retail (purchased by the perpetrator) while 43% come from street sources.
Fact: One academic analysis 18 could find no state level association between retail sales of guns or changes in crime rates.
Myth: Crime guns are trafficked
Fact: Most guns recovered in crime were retailed in the same state in which they were retailed, and those that move between states mainly do so via household relocation (moving to a neighboring state). 19
Fact: The time from acquisition to crime is short (two months) but the “time to crime” for recovered guns is typically 9.2 years. 20 This shows the delay as guns migrate from legal to illegal, and/or from state to state.
Myth: Crime guns mainly come from private transactions
Fact: Private party transfers we significantly less likely to result in firearm related violence than guns acquired from other means including retail (aside from pawn shop purchases). 21
Myth: Guns are not a good deterrent to crime
Fact: Guns prevent an estimated 2.5 million crimes a year or 6,849 every day. 22 Most often, the gun is never fired and no blood (including the criminal’s) is shed.
Fact: Property crime rates are dropping (especially burglaries). The chart shows the legal handgun supply in America (mainly in civilian hands) relative to the property crime rate. 23
Fact: Every year 400,000 life-threatening violent crimes are prevented using firearms.
Fact: 60% of convicted felons admitted that they avoided committing crimes when they knew the victim was armed. 40% of convicted felons admitted that they avoided committing crimes when they thought the victim might be armed. 24
Fact: Felons report that they avoid entering houses where people are at home because they fear being shot. 25
Fact: 59% of the burglaries in Britain, which has tough gun control laws, are “hot burglaries” 26 which are burglaries committed while the home is occupied by the owner/renter. By contrast, the U.S., with more lenient gun control laws, has a “hot burglary” rate of only 13%. 27
Fact: Washington DC has essentially banned gun ownership since 1976 28 and has a murder rate of 56.9 per 100,000. Across the river in Arlington, Virginia, gun ownership is less restricted. There, the murder rate is just 1.6 per 100,000, less than three percent of the Washington, DC rate. 29
Fact: 26% of all retail businesses report keeping a gun on the premises for crime control. 30
Fact: In 1982, Kennesaw, GA passed a law requiring heads of households to keep at least one firearm in the house. The residential burglary rate dropped 89% the following year. 31
Fact: A survey of felons revealed the following: 32
- 74% of felons agreed that, “One reason burglars avoid houses when people are at home is that they fear being shot during the crime.”
- 57% of felons polled agreed, “Criminals are more worried about meeting an armed victim than they are about running into the police.”
Myth: Guns instigate lethal domestic violence
| Maladaptive Behavior | Estimated Co-occurrence with Domestic Abuse |
| Alcohol Abuse | 45% – 60% of incidents |
| General Criminality | 70% – 80% of offenders (prior records) |
| Animal Cruelty | 71% – 83% of high-conflict households |
| Illicit Drug Use | 25% – 50% of offenders in treatment |
| Child Maltreatment | 30% – 60% overlap in homes with children |
Fact: Domestic abusers have high rates of a variety of other maladaptive behaviors. Someone who is willing to abuse a spouse or domestic partner is very frequently suffering from substance abuse, committing child abuse and/or animal cruelty, and committing crimes in general. As such, misusing a gun during a domestic tirade is a byproduct of a large set of behavioral disorders and the violence is not instigated by the presence of a gun. 33
Myth: Gun availability encourages crime
Fact: “The largest risk factor [for using a gun in crime] was prior criminal record: compared to purchasers with no criminal history, those with an arrest within three years prior to purchase had 6.8 times the risk of arrest for a [firearm related violence] crime and four times the risk if their prior arrest was more than three years before the index purchase.” 34
Myth: “Ghost guns” are widely used by criminals
Fact: A survey of the top 100 police agencies for calendar year 2019 showed that at most 1.3% of crime guns were DIY guns (when outlier agencies were removed) and maybe 2% with outlier agencies included.
Myth: Private guns are used to commit violent crimes

Fact: 90% of all violent crimes in the U.S. do not involve firearms of any type. 35
Fact: Even in crimes where the offender possessed a gun during the commission of the crime, 83% did not use or threaten to use the gun. 36
Fact: Fewer than 1% of firearms will ever be used in the commission of a crime. 37
Fact: Two-thirds of the people who die each year from gunfire are criminals being shot by other criminals. 38
Fact: Cincinnati’s review of their gang problem revealed that 74% of homicides were committed by less than 1% of the population. 39
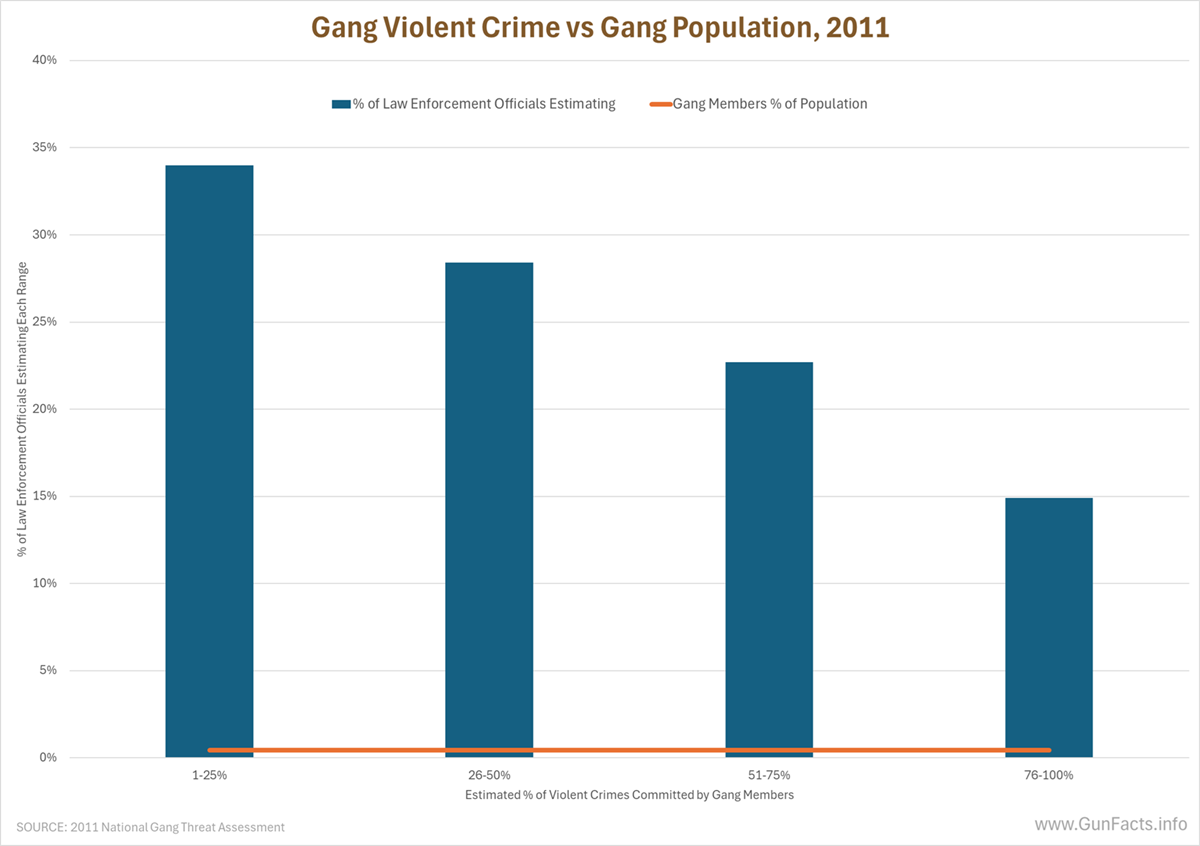
Fact: 92% of gang murders are committed with guns. 40 Gangs are responsible for between 48% and 90% of all violent crimes. 41
Fact: When the estimates of gang violent crime are averaged, we see that over 10% of those crimes are caused by gang members, but that they compose only 0.4% of the population. 42
Fact: Most gun crimes are gang related, and as such are big-city issues. In fact, if mayors in larger cities were more diligent about controlling gang warfare, state and nationwide gun violence rates would fall dramatically.
Myth: 40% of Americans have been or personally know a gun violence victim
Fact: This data was from an unpublished survey conducted by a political research organization. Their own footnote reads “Greenberg Quinlan Rosner Research for the New Venture Fund (Aug. 2011). Note, this is not publicly available data.” 43
Myth: Interstate transportation of guns defeats local gun control
Fact: The BATF reports that the average age of a traced gun is 11 years 44, meaning that most guns moving from state to state were transported when legal owners moved.
Fact: Fewer than 5% of traced guns in California, many of which were not crime guns, came from neighboring Nevada and Arizona. 45
Myth: High-capacity, semi-automatics are preferred by criminals
Fact: The use of semi-automatic handguns in crimes is slightly lower than the ratio of semi-automatic handguns owned by private citizens. Any increase in style and capacity simply reflects the overall supply of the various types of firearms. 46
Myth: Banning “Saturday Night Specials” reduces crime
Fact: This was the conclusion of the Johns Hopkins University Center for Gun Policy and Research – and it is wrong. They studied firearm homicide rates from Maryland after passage of a “Saturday Night Special” ban in 1998. It seems the firearm homicide rate has not subsided and remained between 68-94% higher than the national average through 2008. 47
Fact: Even banning guns does not slow down criminals. In the U.K., where private ownership of firearms is practically forbidden, criminals have and use guns regularly, and even build their own. One enterprising fellow converted 170 starter pistols to functioning firearms and sold them to gangs. Hundreds of such underground gun factories have been established, contributing to a 35% jump in gun violence. 48
Myth: Criminals prefer “Saturday Night Specials” 49
Fact: “Saturday Night Specials” were used in fewer than 3% of crimes involving guns. 50
Fact: Fewer than 2% of all “Saturday Night Specials” made are used in crimes.
Fact: “What was available was the overriding factor in weapon choice [by criminals].” 51
Myth: Gun shows are supermarkets for criminals
Fact: Only 0.8% of convicts bought their firearms at gun shows. 39.2% obtained them from illegal street dealers. 52
Fact: Fewer than 1% of “crime guns” were obtained at gun shows. 53 This is a reduction from a 1997 study that found 2% of guns used in criminal offenses were purchased at gun shows. 54
Fact: The FBI concluded in one study that no firearms acquired at gun shows were used to kill police. “In contrast to media myth, none of the firearms in the study were obtained from gun shows.” 55
Fact: Only 5% of metropolitan police departments believe gun shows are a problem. 56
Fact: Only 3.5% of youthful offenders reported that they obtained their last handgun at a gun show. 57
Fact: 93% of guns used in crimes are obtained illegally (i.e., not at gun stores or gun shows). 58
Fact: At most, 14% of all firearms traced in investigations were purchased at gun shows. 59 But this includes all firearms that the police traced, whether or not they were used in crimes, which overstates the acquisition rate.
Fact: Gun dealers are federally licensed. They are bound to stringent rules for sales that apply equally whether they are selling firearms from a storefront or a gun show. 60
Fact: Most crime guns are either bought off the street from illegal sources (39.2%) or through straw-man purchases by family members or friends (39.6%). 61
Myth: All four guns used at Columbine were bought at gun shows
Fact: Each of the guns was either bought through an intermediary or someone who knew they were going to underage buyers. In all cases there was a purposeful criminal activity occurring and the actors knew they were breaking the law.
Myth: 25-50% of the vendors at most gun shows are “unlicensed dealers”
Fact: There is no such thing as an “unlicensed dealer,” except for people who buy and sell antique — curio — firearms as a hobby (not a business).
Fact: This 25-50% figure can only be achieved if you include those dealers not selling guns at these shows. These non-gun dealers include knife makers, ammunition dealers, accessories dealers, military artifact traders, clothing vendors, bumper-sticker sellers, and hobbyists. In short, 50% of the vendors at shows are not selling firearms at all!
Myth: Regulation of gun shows would reduce “straw sales”
Fact: The main study that makes this claim had no scientific means for determining what sales at the show were “straw sales.” Behaviors that Dr. Wintemute cited as “clear evidence” of a straw purchase were observational only and were more likely instances of more experienced acquaintances helping in a purchase decision. No attempts were made to verify that the sales in question were straw sales. 62
Myth: Prison isn’t the answer to crime control
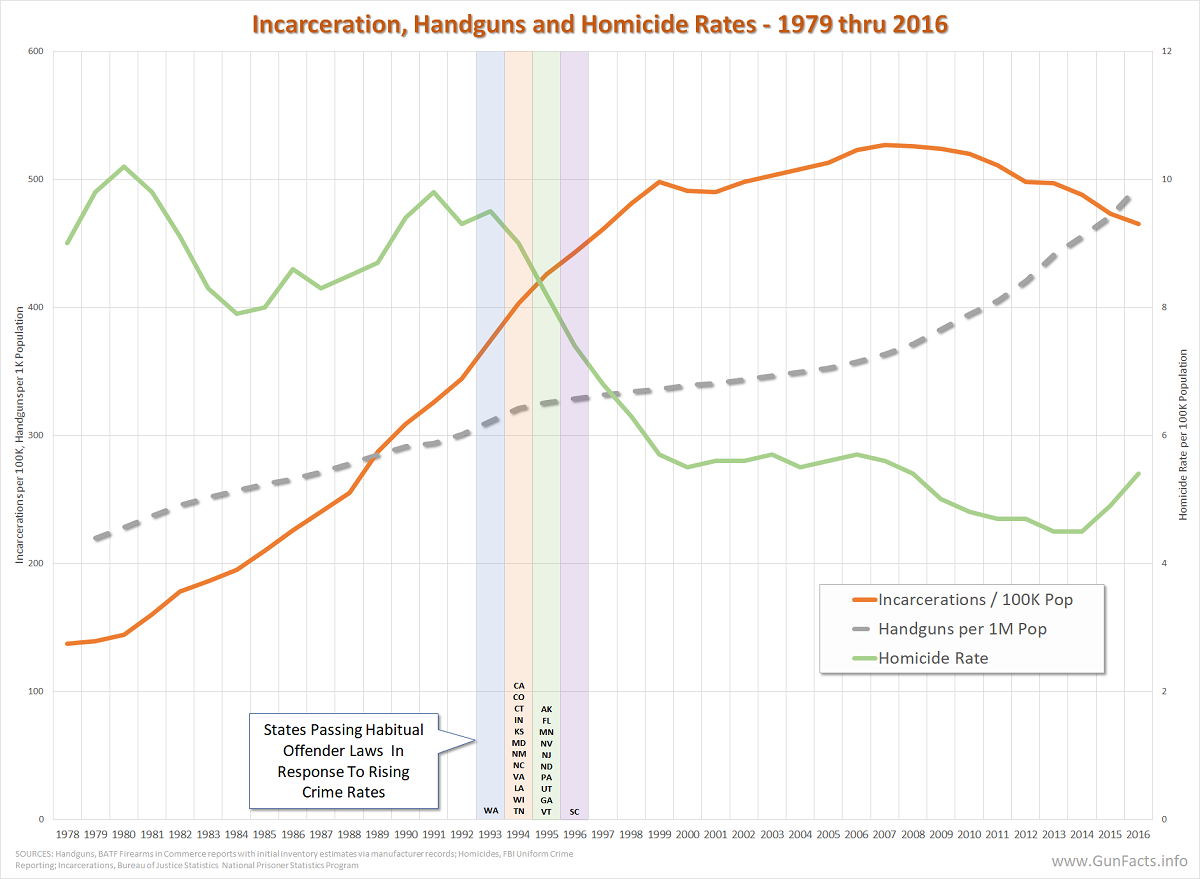 Fact: 24 states, in a four year period, enacted habitual offender laws (in response to escalating violent crime rates) and the incarceration of these repeat offenders led to violence rates dropping nationally while the handgun supply kept rising. See our study on habitual offender laws.
Fact: Why does crime rise when criminals are released from prison early? Because they are likely to commit more crimes. 67.5% were re-arrested for new felonies or serious misdemeanors within three years. Extrapolating, those released felons killed another 2,282 people. 63
Fact: 45% of state prisoners were, at the time they committed their offense, under conditional supervision in the community – either on probation or on parole. 64 Keeping violent convicts in prison would reduce violent crimes.
Fact: Homicide convicts serve a little more than half of their original sentences. 65 Given that men tend to be less prone to violent behavior as they age, 66 holding them for their full sentences would probably reduce violence significantly.
Fact: Los Angeles County saw repeat offender and re-arrest rates soar after authorities closed jails and released prisoners early. In less than three years, early release of prisoners in LA resulted in: 67
- 15,775 rearrested convicts
- 1,443 assault charges 68
- 518 robbery charges
- 215 sex-offense charges
- 16 murder charges
Fact: In 1991, 13,200 homicides were committed by felons on parole or probation. For comparison sake, this is about half of the 1999 annual gun death totals (keep in mind that gun deaths fell from 1991 to 1999).
Myth: Waiting periods prevent rash crimes and reduce violent crime rates
Fact: The “time-to-crime” of a firearm is about 11 years, making it rare that a newly purchased firearm is used in a crime. 69
Fact: The national five-day waiting period under the Brady Bill had no impact on murder or robbery. In fact, there was a slight increase in rape and aggravated assault, indicating no effective suppression of certain violent crimes. Thus, for two crime categories, a possible effect was to delay law-abiding citizens from getting a gun for protection. The risks were greatest for crimes against women. 70
Fact: Comparing homicide rates in 18 states that had waiting periods and background checks before the Brady Bill with rates in the 32 states that had no comparable laws, the difference in change of homicide rates was “insignificant”. 71
Myth: 86% of Americans, 82% of gun owners favor universal background checks
Fact: Those statistics came from a pair of surveys reported by gun control group Mayors Against Illegal Guns, who has been caught stacking survey responses by polling left-of-center mailing lists.
Myth: Gun makers are selling plastic guns that slip through metal detectors
Fact: There is no such thing as a ‘plastic gun’. This myth started in 1980 72 when Glock began marketing a handgun with a polymer frame, not the entire firearm. Most of a Glock is metal (83% by weight) and detectable in common metal and x-ray detectors. “[D]espite a relatively common impression to the contrary, there is no current non-metal firearm not reasonably detectable by present technology and methods in use at our airports today, nor to my knowledge, is anyone on the threshold of developing such a firearm.” 73
Incidentally, Glocks are one of the favorite handguns of police departments because it is lightweight, thanks to the polymer frame.
Myth: Machine guns 74 are favored by criminals
Fact: In the drug-ridden Miami of 1980, fewer than 1% of all gun homicides were with machine guns. 75
Fact: None of over 2,220 firearms recovered from crime scenes by the Minneapolis police in 1987-89 were machine guns. 76
Fact: 0.7% of seized guns in Detroit in 1991-92 were machine guns. 77
Myth: Corrupt dealers sell almost 60 percent of crime guns
Fact: Only 0.5% of the reported traces were for an original purchase of three years or less before the trace was conducted. 78 Thus, 99.5% of retailer sales had left their control long before the gun was traced (and many traces are not for crime guns).
Fact: The average “time to crime”, the time between the retail sale of a firearm and its use in a crime is eleven years. A firearm can change hands and travel far in six years.
Notes:
- City of Charlotte Gunshot Study, Department of Criminal Justice, Lumb, Friday,1994 ↩
- Homicides and Non-Fatal Shootings: A Report on the First 6 Months Of 2009, Milwaukee Homicide Review Commission, July 13, 2009 ↩
- Firearm-related Injury Incidents in 1999 – Annual Report, San Francisco Department of Public Health and San Francisco Injury Center, February 2002 ↩
- Homicide Trends in the United States, 1980-2008, Bureau of Justice Statistics, November 2011 ↩
- Assessing the interaction between offender and victim criminal lifestyles & homicide type; Pizarro, Zgoba, Jennings; Journal of Criminal Justice; 2011 ↩
- Examining the Recidivism of Firearm Offenders Using State Criminal History and Mortality Data; Westley, Kang; 2018; Illinois Criminal Justice Information Authority ↩
- Taking Stock of Gang Violence: An Overview of the Literature; Valasik, Reid; 2019 ↩
- Assessing the interaction between offender and victim criminal lifestyles & homicide type – Pizarro, Zgoba, Jennings – Journal of Criminal Justice – 2011 ↩
- Assessing the interaction between offender and victim criminal lifestyles & homicide type – Pizarro, Zgoba, Jennings – Journal of Criminal Justice – 2011 ↩
- Assessing the interaction between offender and victim criminal lifestyles & homicide type – Pizarro, Zgoba, Jennings – Journal of Criminal Justice – 2011 ↩
- Firearm Violence, 1993-2011, BJS ↩
- Ongoing Bureau of Justice Statistics incarcerated felon interview process, with variability in the years the interviews were conducted. ↩
- Source and Use of Firearms Involved in Crimes: Survey of Prison Inmates, Bureau of Justice Statistics, 2016 ↩
- The Last Link: from Gun Acquisition to Criminal Use, Cook, Pollack, White, 2019 ↩
- Sources of guns to dangerous people: What we learn by asking them, Cook, Parker, Pollack, Preventive Medicine, Volume 79, October 2015 ↩
- Gaps continue in firearm Surveillance: Evidence from a large U.S. city Bureau of Police, Fabio, Duell, Creppage, O’Donnell and Laporte, Social Medicine, Vol 1, 2016 ↩
- Sources of guns to dangerous people: What we learn by asking them, Cook, Parker, Pollack, Preventive Medicine, Volume 79, October 2015 ↩
- Legal Firearm Sales at State Level and Rates of Violent Crime, Property Crime, and Homicides; Hamill, Hernandez, Bailey, Cutherell, Zielinski, Jenkins, Naylor, Matos, Collier, Schiller; August 2022 ↩
- BATF trace records and Census Bureau for 2006, summarized in blog post Rust Pipeline ↩
- The Last Link: from Gun Acquisition to Criminal Use; Cook, Pollack, White; Journal of Urban Health; 2019 ↩
- Individual, firearm, and purchasing characteristics associated with risk of firearm-related violent crime arrest: a nested case-control study; Laqueur, Schleimer, Shev, Kagawa; Injury Epidemiology; 2024 ↩
- Targeting Guns, Dr. Gary Kleck, Criminologist, Florida State University, Aldine, 1997 ↩
- National Crime Victimization Survey, 2000, Bureau of Justice Statistics, BATF estimates on handgun supply ↩
- Armed and Considered Dangerous: A Survey of Felons and Their Firearms, James Wright and Peter Rossi, Aldine, 1986 ↩
- Armed and Considered Dangerous: A Survey of Felons and Their Firearms, James Wright and Peter Rossi, Aldine, 1986 ↩
- A “hot burglary” is when the burglar enters a home while the residents are there ↩
- Dr. Gary Kleck, Criminologist, Florida State University (1997) and Kopel (1992 and 1999) ↩
- The Supreme Court invalidated the D.C. handgun ban in the Heller case (2008), but the city has made obtaining a handgun very difficult via local legislation ↩
- Crime in the United States, FBI, 1998 ↩
- Crime Against Small Business, U.S. Small Business Administration, Senate Document No. 91-14, 1969 ↩
- Crime Control Through the Private Use of Armed Force, Dr. Gary Kleck, Social Problems, February 1988 ↩
- The Armed Criminal in America: A Survey of Incarcerated Felons, U.S. Bureau of Justice Statistics Federal Firearms Offenders study, 1997: National Institute of Justice, Research Report, July 1985, Department of Justice ↩
- Barrett, B. J., Fitzgerald, A., Stevenson, R., & Cheung, C. H. (2017). Animal Maltreatment as a Risk Marker of More Frequent and Severe Forms of Intimate Partner Violence. Journal of Interpersonal Violence, 35(23-24), 5131-5156.
Doswell, A., Kazmir, S., Segal, R., & Tiyyagura, G. (2025). Impact of Intimate Partner Violence on Children. Pediatric Clinics of North America.
Jegatheesan, B., Enders-Slegers, M.-J., Ormerod, E., & Boyden, P. (2020). Understanding the Link between Animal Cruelty and Family Violence: The Bioecological Systems Model. International Journal of Environmental Research and Public Health, 17(9), 3116.
Jordan, C. E., Pritchard, A. J., Duckett, D., & Charnigo, R. (2010). Criminal Offending Among Respondents to Protective Orders: Crime Types and Patterns That Predict Victim Risk. Violence Against Women, 16(12), 1396-1411.
Moylan, C. A., Herrenkohl, T. I., Sousa, C., Tajima, E. A., Herrenkohl, R. C., & Russo, M. J. (2009). The Effects of Child Abuse and Exposure to Domestic Violence on Adolescent Internalizing and Externalizing Behavior Problems. Journal of Family Violence, 25(1), 53-63.
Smith, P. H., Homish, G. G., Leonard, K. E., & Cornelius, J. R. (2012). Intimate partner violence and specific substance use disorders: Findings from the National Epidemiologic Survey on Alcohol and Related Conditions. Psychology of Addictive Behaviors, 26(2), 236-245. ↩
- Individual, firearm, and purchasing characteristics associated with risk of firearm-related violent crime arrest: a nested case-control study; Laqueur, Schleimer, Shev, Kagawa; Injury Epidemiology; 2024 ↩
- Bureau of Alcohol, Tobacco and Firearms, 1998 ↩
- National Crime Victimization Survey, 1994, Bureau of Justice Statistics ↩
- FBI Uniform Crime Statistics, 1994 ↩
- FBI Uniform Crime Statistics, 1994 ↩
- Implementation of the Cincinnati Initiative to Reduce Violence (CIRV), University of Cincinnati Policing Institute, 2008 ↩
- Homicide trends in the United States, Bureau of Justice Statistics, November 2011 ↩
- 2011 National Gang Threat Assessment, FBI, September 2011 ↩
- 2011 National Gang Threat Assessment, FBI, September 2011 ↩
- Preventing Gun Violence Through Effective Messaging, OMP, KNP Communications, 2012 ↩
- BATF report #133664, California Tracing Reports for 2012 ↩
- BATF report #133664, California Tracing Reports for 2012 ↩
- Targeting Guns, Dr. Gary Kleck, Criminologist, Florida State University, Aldine, 1997 ↩
- Injury Mortality Reports 1999-2008, Center for Disease Control, online database ↩
- Gun crime spreads ‘like a cancer’ across Britain, The Guardian, Oct 5, 2003 ↩
- “Saturday Night Special” is a term, with racist origin, describing an inexpensive firearm. Part of the origin of the term came from “suicide special”, describing an inexpensive handgun purchased specifically for committing suicide. The racist origins are too detestable to repeat here. ↩
- FBI Uniform Crime Statistics, 1994 ↩
- Violent Encounters: A Study of Felonious Assaults on Our Nation’s Law Enforcement Officers, U.S. Department of Justice, August 2006 ↩
- Firearm Violence, 1993-2011, BJS ↩
- Violent Encounters: A Study of Felonious Assaults on Our Nation’s Law Enforcement Officers, U.S. Department of Justice, August 2006 ↩
- Homicide in Eight U.S. Cities, National Institute of Justice, December 1997 ↩
- Violent Encounters: A Study of Felonious Assaults on Our Nation’s Law Enforcement Officers, U.S. Department of Justice, August 2006 ↩
- On the Front Line: Making Gun Interdiction Work, Center to Prevent Handgun Violence, February 1998, survey of 37 police departments in large cities ↩
- Patterns in Gun Acquisition and Use by Youthful Offenders in Michigan, Timothy S. Bynum, Todd G. Beitzel, Tracy A. O’Connell & Sean P. Varano, 1999 ↩
- BATF, 1999 ↩
- BATF, June 2000, covers only July 1996 through December 1998 ↩
- BATF, 2000 ↩
- Firearm use by Offenders, Bureau of Justice Statistics, November 2001 ↩
- Gun shows across a multistate American gun market, Dr. GJ Wintemute, British Medical Journal, 2007 ↩
- Reentry Trends in the U.S., Recidivism, Department of Justice, 1999 ↩
- US Bureau of Justice Statistics, 1991 ↩
- Firearm Use by Offenders, Bureau of Justice Statistics, November, 2001 ↩
- Homicide rates peak in the 18-24-year-old group, Bureau of Justice Statistics, online database ↩
- Releasing Inmates Early Has a Costly Human Toll, Los Angeles Times, May 14, 2006 ↩
- Keep in mind these are just charges. Each arrested convict may have committed multiple crimes. ↩
- Bureau of Alcohol, Tobacco and Firearms as reported by Time Magazine, July 12, 2002 ↩
- Dr. John Lott Jr., University of Chicago School of Law, 1997 ↩
- Dr. Jens Ludwig, Dr. Philip J. Cook, Journal of the American Medical Association, August 2000 ↩
- Heckler and Koch made a polymer framed firearm earlier, in 1968, but the myth seems to have erupted after Glock began promoting theirs to police departments. ↩
- Billie Vincent, FAA Director of Civil Aviation Security, House Subcommittee on Crime, May 15, 1986 ↩
- In this myth, “machine gun” represents “fully automatic” firearms, ones that fire bullets as long as the trigger is pulled ↩
- Miami Herald, August 23, 1984, based on figures from Dr. Joseph Davis, Dade County medical examiner ↩
- 1994, Minnesota Medical Association Firearm Injury Prevention Task Force ↩
- J. Gayle Mericle, 1989, Unpublished report of the Metropolitan Area Narcotics Squad, Will and Grundy Counties ↩
- Following the Gun: Enforcing Federal Law Against Firearms Traffickers, BATF, 2000 ↩