Basic Data and Trends
Unless otherwise noted, we present data for 2019… and with good reason.
The pandemic years saw erratic shifts in homicides, suicides and violent crimes. Some of this was due to the pandemic, the lockdowns, et cetera. Some was due to the George Floyd murder and riots. Some was due to the “defund the police” movement and the operational withdrawal of police from the streets.
2019 was the last pre-pandemic year and thus more representative of the “static” reality. We caution journalists to watch for organizations presenting any pandemic-period data, and especially if they:
- Only show that data
- Try to combine pre- or post-pandemic data as a “trend”
Who is killed with guns?

click to enlarge
Year in and year out, most gun deaths are by suicide. This is where some policy organizations get into trouble. For 2019, they might say “39,000 people died from gun violence” but they fail to note that 60%, or 23,941 of those deaths, were by suicide. This is an important distinction since the causes leading to suicide and homicide are very different.
Suicides
Gun suicides are most frequent among white, rural, old males. This is a significant contrast to gun homicides (see next section) which are mainly committed by young, urban males.

click to enlarge

click to enlarge

click to enlarge
Homicides

click to enlarge
Gun homicides occur primarily among young, urban, black males. This is one of the key demographic profiles reported by the Nation Gang Center.
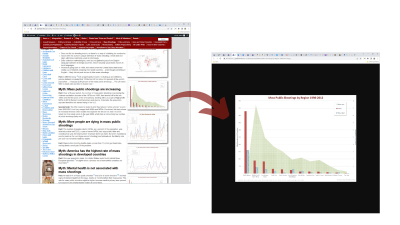
Unintentional (accidental)

click to enlarge
Accidental (unintentional) gun deaths have been falling steadily over time, while most estimates of household firearm ownership have remained steady (roughly 43% of households).
The plunge started at a time when 24 states enacted habitual offender laws (e.g., “three strikes”) and as more states permitted public carrying of firearms (typically “shall issue” concealed carry).

click to enlarge
This table shows the expansion of public carry laws, and the red box (1992 through 1995) shows a period when 24 states passed habitual offender laws.
This data is presented because we have not uncovered data or academic papers detailing what major factors led to the rapid decline in accidental gun deaths. But the data does show that steady household gun ownership rates, gun availability, and public carry of guns are statistically disassociated from the falling accidental gun death rates.
How do deaths by guns compare to deaths by other means in each group?

click to enlarge
This chart shows what percentage of non-suicide deaths in each age group occur from firearms. This includes homicides, accidents, legal interventions and unknown causes.
Note that in the “children” group, we excluded deaths for children under the age of one. This is because an extremely large number of infant deaths occur from prenatal condition, genetic disorders, and the like. Including them would have distorted the reality about guns in this age group.
What are the long-term trends?

click to enlarge
Over time, firearm homicides have dropped from their peak in 1993, primarily due to 24 states passing habitual offender laws in that era.
Into the twenty-first century, suicide rates have climbed in general, with suffocation being the fastest growing means. But with more suicidal people in general, comes more gun suicides.