
City Size and Police Professionalism
Local culture, local economics, and perhaps local police professionalism may be key drivers to lower gun homicide rates … even when the potential for street gang activity is high.
Take-Aways
- Some, slightly fragile, indication that the professionalism of a law enforcement agency is associated with lower gun murder rates
Cops and Gangs
In our rather detailed Top 15 Murder County study, we noticed that among the most murderous counties, there was a combination of low police staffing and a high percentage of the population that were males of street gang age. With new and very detailed data via the National Incident-Based Reporting System (NIBRS), we thought to look at cities instead of counties, knowing that core cities (Chicago) more that the surrounding county (Cook County) might offer some validation of what we saw at the county level.
But … nothing is that straightforward.
Crime data remains messy. Less messy than in the early days of the FBI’s switch-over form the long-standing Uniform Crime Reports (UCR) to the new and expansive National Incident-Based Reporting System (NIBRS). But the most recent NIBRS data (as of this writing) is for 2023 and there are significant problems.
Such as Los Angeles and Phoenix not reporting that year.
That alone is over 3% of the national population. When we look at smaller metropolises, San Francisco and Tucson are AWOL (another Cali–Ariz combo). Smaller yet, New Orleans, Oakland, Orlando, Pittsburgh, Saint Petersburg are absent too.
The word here is “take this analysis as fragile around the edges.”
Gangs and Cops are Not All The Same
Within the Top 15 Murder Counties, the correlation of low police staffing and a high percentage of the population being in the primary street gang demographics 1 was strong. Yet, this association did not appear universal elsewhere, so we wanted to test it along with another hunch we had: does the degree of professionalism of a police force have an effect?
That last one was important because while scanning the data we saw cities with significant populations, lowish police staffing, and ample street gang potential, but they had lower gun homicide rates. Granted, there are a lot of other variables that help explain differences. Los Angeles and San Diego counties are in California – and thus live under the same gun control laws – but they have different economies, with the latter being better off and their gun homicide rate being lower. LA has more people while SD has a higher median household income, etc, etc.
But LA’s police department has a “reputation.”[ED: Gun Facts founder Guy Smith grew up around cops, married into a police family, and notes that every officer outside of LA whom he has spoken with thinks LAPD is a criminal organization.] LA also has a major gun violence disorder. SDPD lacks LA’s reputation and LA’s murder fettish.
Therefore, the “professionalism” of an agency might have some effect on the level of gun violence. Recall that Cook County (Chicago) had an abysmal homicide clearence rate. That lack of police efficacy literally allows murders to stay on the streets. Other large cities with better police departments and higher clearance rates typically had lower gun homicide rates even when the potential for gang membership was just as high.
But … the data is very messy
We are seldom surprised by the state of available data, which ranges from okay to horrible. But in this case it was practically nonexistent.
There is no consistent national system for measuring the quality of police departments. There are data collections like Law Enforcement Management and Administrative Statistics (LEMAS), which has interesting data that we could (and tried) to build a model from. But LEMAS is fed by voluntary submissions and thus woefully incomplete (about 3,400 entries for over 18,000 law enforcement agencies, and many of those that did report are smaller agencies and not very useful here).
 |
 |
 |
 |
 |
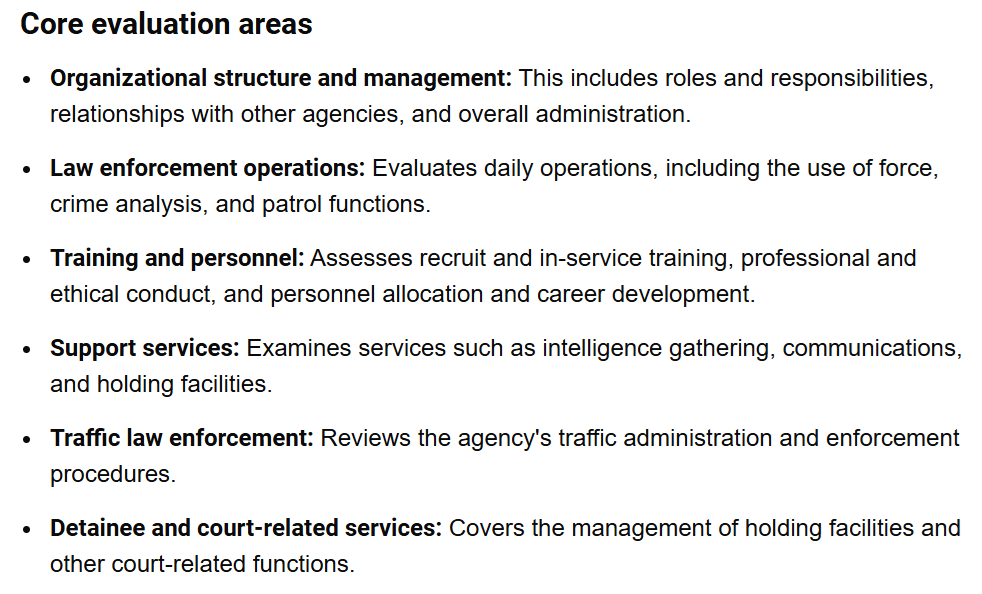
The only close-enough-for-government-work proxy we found was the Commission on Accreditation for Law Enforcement Agencies (CALEA) certification program. Yet, they have only 553 agencies in their most recent dataset; but interestingly, the gaps are fewer for larger agencies. This makes some minimal perspective possible.
All Cities, All Gangs, One Big City Problem
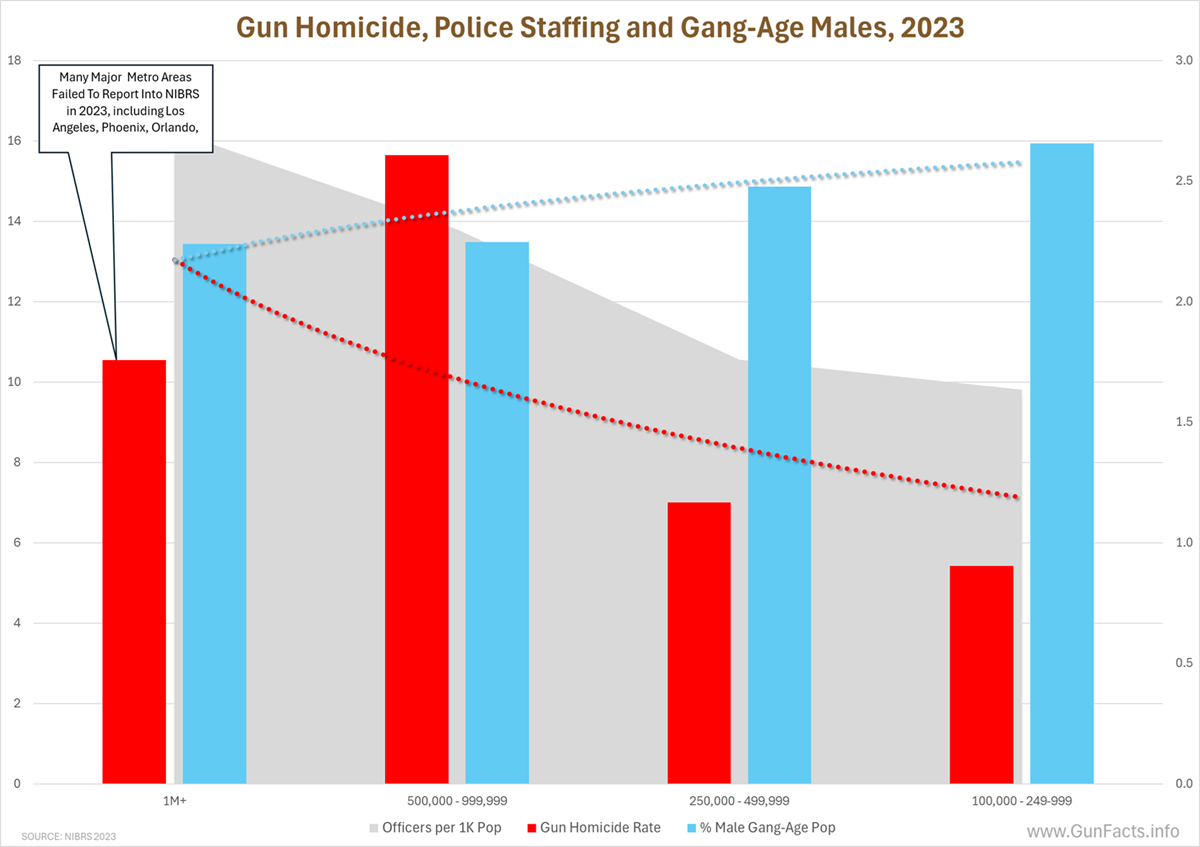
Among all the population groups defined within NIBRS, we see an unexpected data pattern with one huge caveat.
A number of large agencies had not reported crime data into NIBRS in 2023, the most recent year of data as of this writing. Los Angeles is MIA. So too are Orlando, Phoenix and others. This is the core of the problem on the left side of the chart where the biggest cities (with typically the largest street gang presence) falsely appear to have lower gun homicide rates and fewer potential street gang members.
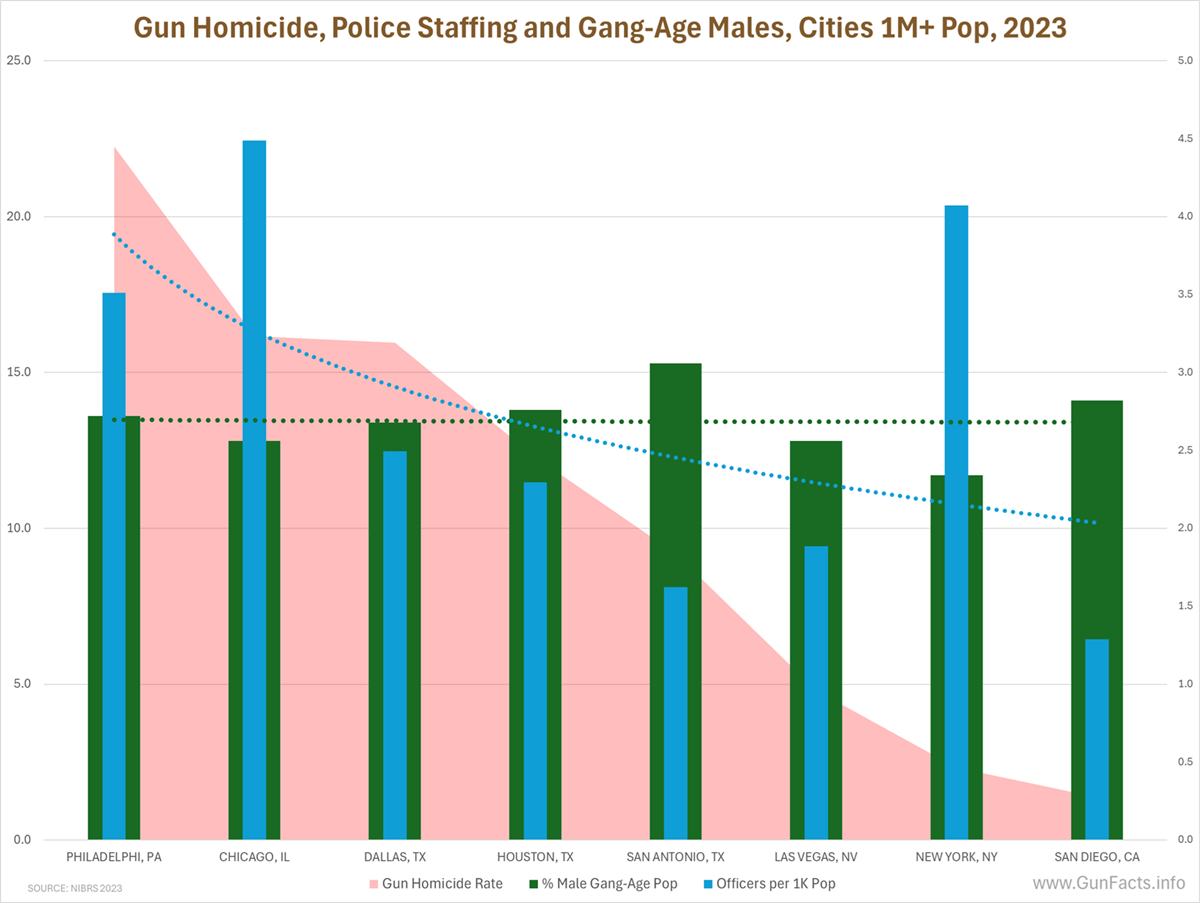
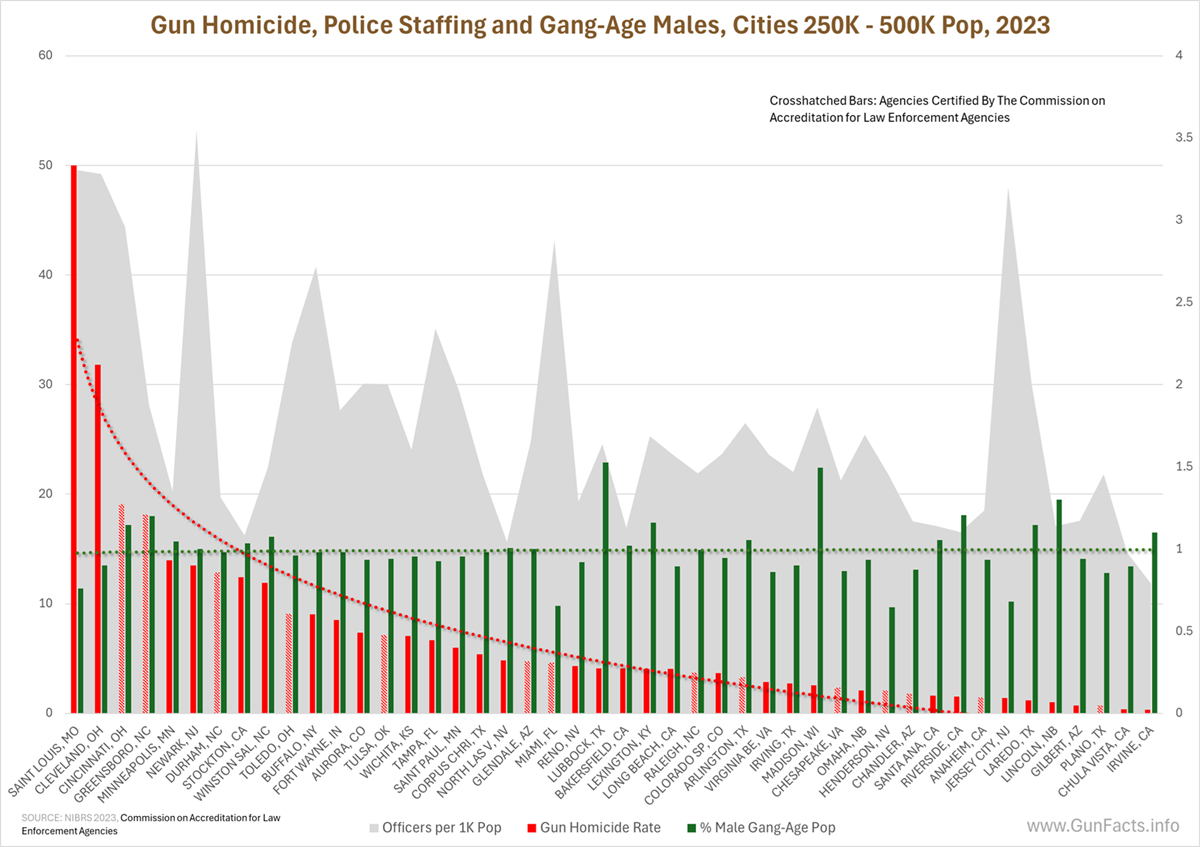
Among the biggest cities, those with a population of more than a million folk, and the few that reported into NIBRS, we see several opposing trends. Though the number of street-gang-aged males is consistent across them, the gun homicide rate and the number of police officers per capita declines. Again, many factors can explain this, including economics, local court and prosecutor attitudes, and more. But it does illustrate the point that either or both agency staffing and the potential for street gang membership are not the only important variables.
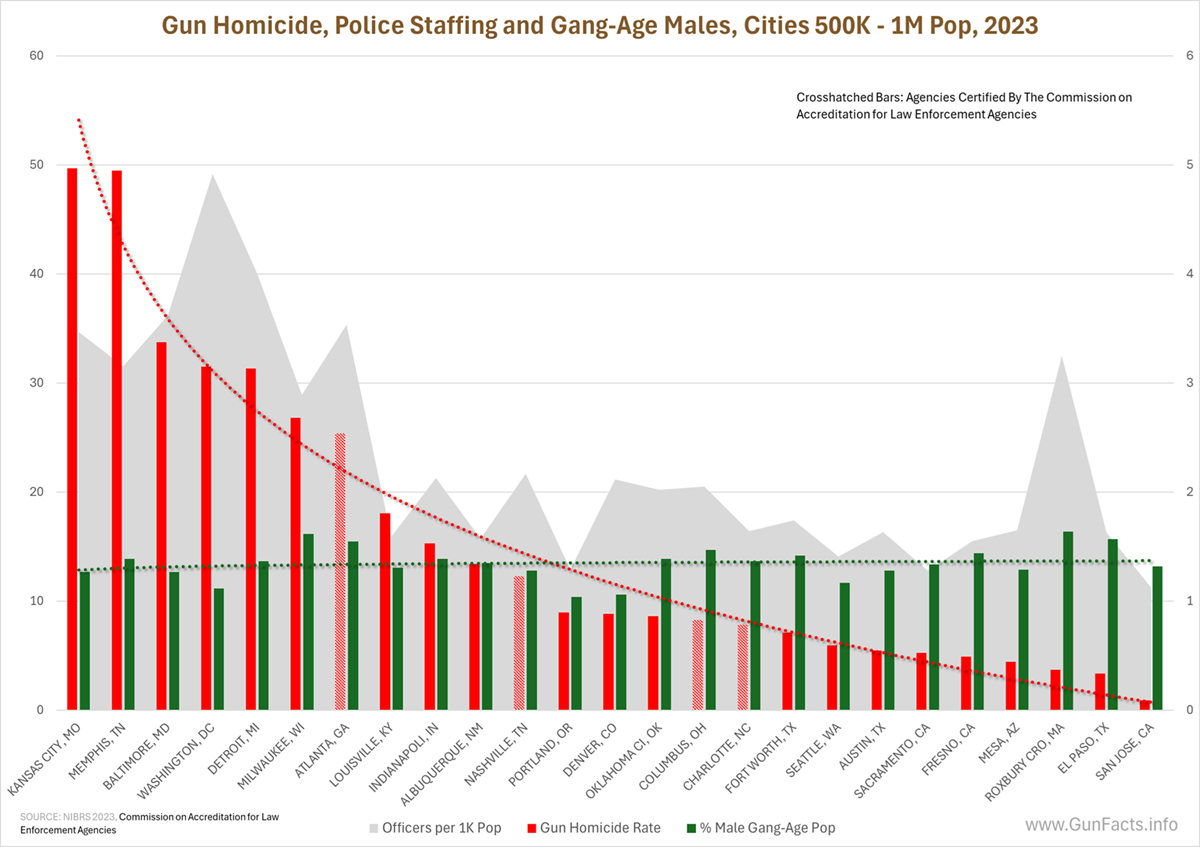
The pattern repeats in more detail within the next population group, cities with between 500,000 and one million residents. Potential street gang member rates are all but level, yet gun murders and police staffing decline.
The same pattern replays in the next population group as well. But we have to go back to the original observation from our Top 15 Murder County study – that low police staffing and high street gang potential was covariant with high gun murder rates and low clearance rates. Staffing is but one aspect of an agency’s ability to combat crime, including gun crime. An agency can be proactive in fighting crime or reactive. The more “professional” an agency is, the more likely it is to do well on both fronts.
In the chart above, the agencies that were accredited by CALEA are cross-hatched. It is an imperfect fit, but the general trend for gun murder rates – regardless of the availability of street gang candidates – matches agency “professionalism.” In this chart, for the next population group, the same rough fit applies.
Here is a single comparison to illustrate the point: Cook County (Chicago) is a “large metro” county with 3.3 officers for every 1,000 residents. So is Denver County, Colorado. Cook had a firearm homicide rate of 9.8 and Denver 7.5.
It is a big assumption, but for a moment assume that the professionalism of non-accredited agencies is roughly equal to that of similar sized agencies. The number of officers per capita becomes less important than the effectiveness of agency as a whole.
Proper Execution
As advised, take this text as advisory. The data is weak, no confounding variables were used, yada, yada, yada. But there is some indication that how an agency is staffed, trained, and monitored affects its professionalism, and that in turns drives gun violence down.
We have identified sets of non-gold standard data and will evaluate them down the road. Perhaps we can cobble together a robust scorecard of police agency professionalism and test all this again.
Notes:
- Nation gang Center ↩
Comments
City Size and Police Professionalism — No Comments
HTML tags allowed in your comment: <a href="" title=""> <abbr title=""> <acronym title=""> <b> <blockquote cite=""> <cite> <code> <del datetime=""> <em> <i> <q cite=""> <s> <strike> <strong>