Below are various infographics that debunk gun control myths or the proponents of such. Clicking on the graphic will display or allow downloading of the high-resolution version. Right click and select "Save target as ..." or "Save Link As ..." to save the high resolution image to your computer.
Description
Infographic
Infographics showing that 15 counties in the United states, with 8% of the population produce 25% of all gun homicides.
Demographics of street gang members against the rate of gun homicides for those demographics.
The demographics were identified by the U.S. government's National gang Center.
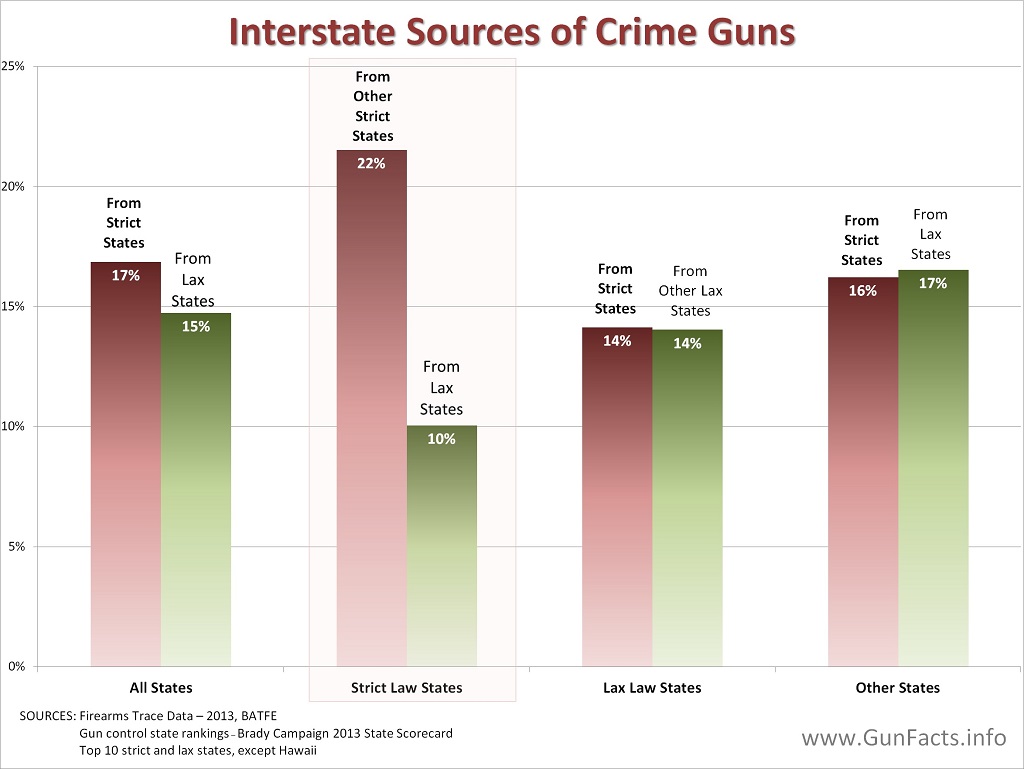
States with "strict" gun control laws get a larger share of traced crime guns from other "strict" states, and not states with "lax" gun control laws.
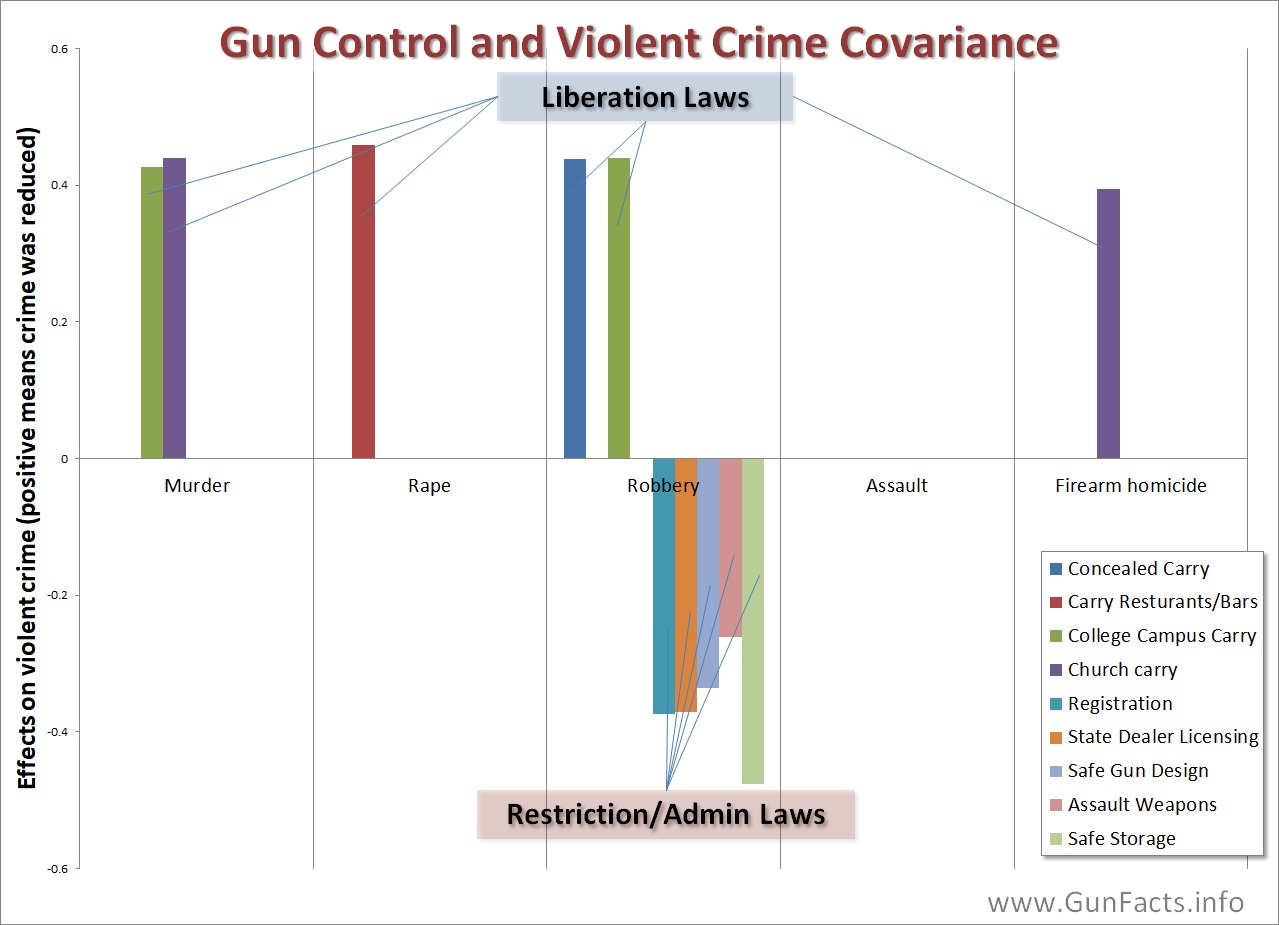
What works and does not work in terms of gun control laws at the state level. Most restrictive and paper work laws do nothing to reduce crime, and may encourage robbery.
Infographic showing that the U.S. homicide rate fell during expansion of concealed carry laws. It also shows how homicides rose during both Prohibition and America's War On Drugs.
How likely are you to die in a mass shooting? It is the least of your worries. You are more than a thousand times more likely to die from Parkinson's Disease.
What is the probability of being injured by an attacker given various ways of defending yourself? If you want to stay whole and healthy, using a gun is your top option.
Do more guns cause less crime? There are many variables to examine, but we can see that a rise in handgun availability/supply and the number of states with shall-issue and constitutional concealed carry coincided with a drop in firearm violence (fatal and non-fatal). Though this does not prove that more guns leads to less crime, it does show that they don't create a bigger problem.
Defensive Gun Uses (DGUs) primarily occur at or near the defenders home.
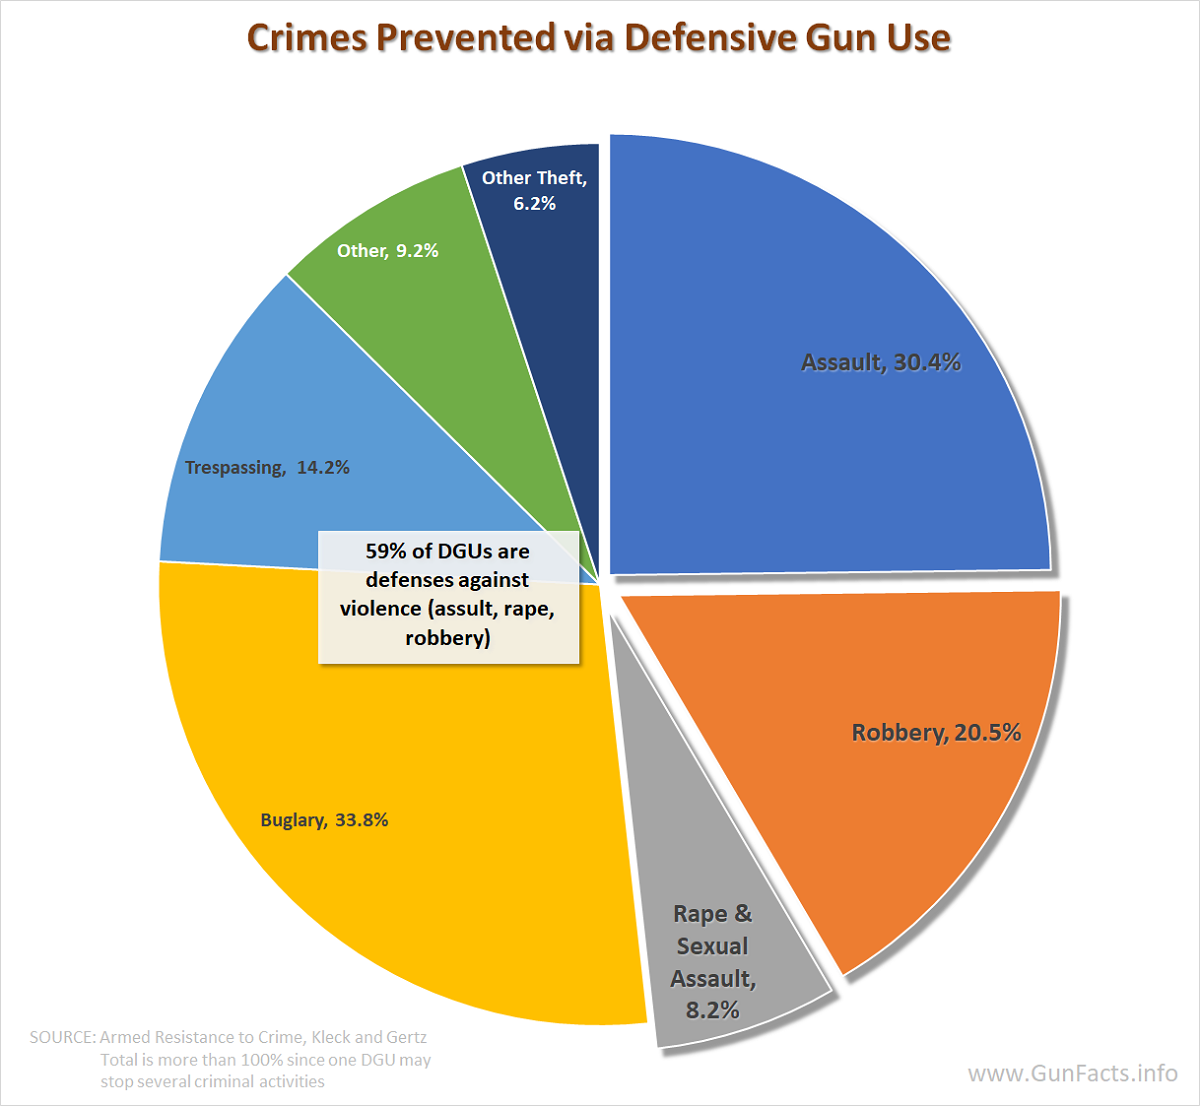
Defensive Gun Uses (DGUs) prevent a variety of crimes. Most importantly, almost 60% of the crimes prevented involved at least one violent crime (some instances involve multiple crimes, hence why the pie slices are more than 100% and that the violent crime slices, though including 59% of all instances are less than 50% of all crimes committed).
New York City's low violent crime rate is not from its ancient gun control laws, but from recent bulking-up of the police force and clean-up of crime-ridden neighborhoods. It also mirrors the drop in violence nationally.
We use technologies like cookies to store and/or access device information. We do this to improve browsing experience and to show (non-) personalized ads. Consenting to these technologies will allow us to process data such as browsing behavior or unique IDs on this site. Not consenting or withdrawing consent, may adversely affect certain features and functions.
Functional
Always active
The technical storage or access is strictly necessary for the legitimate purpose of enabling the use of a specific service explicitly requested by the subscriber or user, or for the sole purpose of carrying out the transmission of a communication over an electronic communications network.
Preferences
The technical storage or access is necessary for the legitimate purpose of storing preferences that are not requested by the subscriber or user.
Statistics
The technical storage or access that is used exclusively for statistical purposes.The technical storage or access that is used exclusively for anonymous statistical purposes. Without a subpoena, voluntary compliance on the part of your Internet Service Provider, or additional records from a third party, information stored or retrieved for this purpose alone cannot usually be used to identify you.
Marketing
The technical storage or access is required to create user profiles to send advertising, or to track the user on a website or across several websites for similar marketing purposes.
The content on this web site is free to use by everyone under American-style "fair use" doctrine. This means you may copy/paste, link to and otherwise make use of all the content herein ... providing you don't change any of it and you give us credit (preferably linking back to our website).
In particular, we encourage you to reuse all the graphics and short sections of text.
For those in the E.U., this is a pre-license. You are not required to seek a specific license from us before using or linking.
Nearly every chart and graph on Gun Facts is free to share (providing you don't change anything).
To get a larger version to share, just click the chart and the larger version will pop-up in a new tab.