
Myth: Gun control reduces crime
Fact: There are more than 22,000 1 gun laws at the city, county, state, and federal level. If gun control worked, then we should be free of crime. Yet the U.S. government “found insufficient evidence to determine the effectiveness of any of the firearms laws or combinations of laws reviewed on violent outcomes” 2 and also concluded in one study that none of the attackers interviewed was “hindered by any law – federal, state or local –that has ever been established to prevent gun ownership. They just laughed at gun laws.” 3
 Fact: Violent crime appears to be encouraged by gun control. Most gun control laws in the United States have been written since 1968, yet the murder rate rose during the 70s, 80s and early 90s. 4
Fact: In 1976, Washington, D.C. enacted one of the most restrictive gun control laws in the nation. The city’s murder rate rose 134 percent through 1996 while the national murder rate dropped 2 percent. 5
Fact: Among the 15 states with the highest homicide rates, 10 have restrictive or very restrictive gun laws. 6
Fact: Maryland claims to have the toughest gun control laws in the nation and ranks #1 in robberies and #4 in both violent crime and murder. 7 The robbery rate is 70% more than the national average. 8 These numbers are likely low because one of their more violent cities, Baltimore, failed to report their crime levels.
Fact: In 2000, 20% of U.S. homicides occurred in four cities with just six percent of the population – New York, Chicago, Detroit, and Washington, D.C. – most of which had a virtual prohibition on privately owned handguns at the time. 9
Fact: The landmark federal Gun Control Act of 1968, banning most interstate gun sales, had no discernible impact on the criminal acquisition of guns from other states. 10
Fact: Washington, D.C.’s 1976 ban on the ownership of handguns (except those already registered in the District) was not linked to any reduction in gun crime in the nation’s capital. 11
Fact: New York has one of the most restrictive gun laws in the nation – and 20% of the armed robberies. 12
Fact: In analyzing 10 different possible reasons for the decline in violent crime during the 1990s, gun control was calculated to have contributed nothing (high imprisonment rates, more police and legalized abortion were considered the primary factors, contributing as much as 28% of the overall reduction). 13
Myth: California’s tough gun laws reduced gun deaths
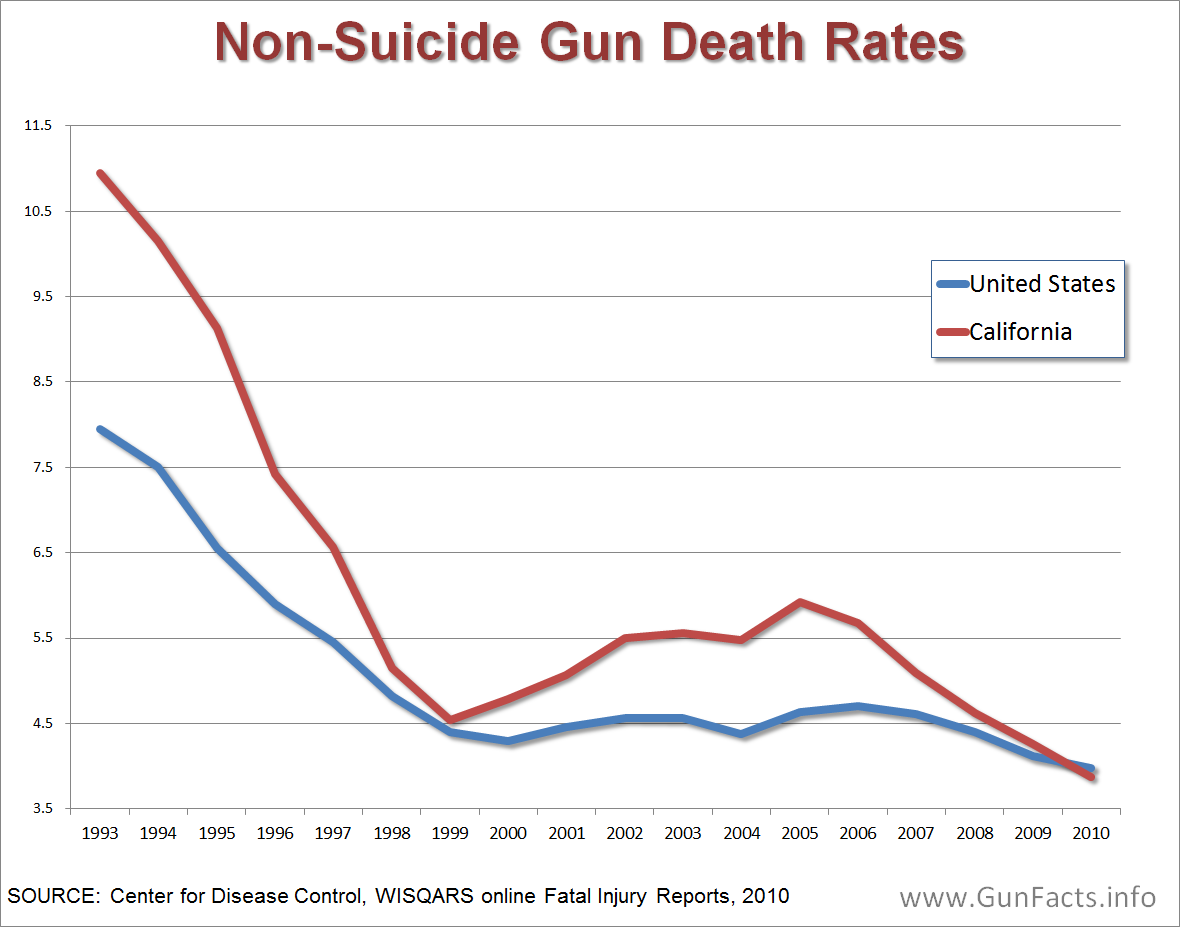 This myth, promoted primarily by the Law Center to Prevent Gun Violence and covering years 1993 through 2013, has three major flaws:
- Suicides, which are 61% 14 of gun deaths, fell much faster in California than the rest of the nation.
- At the starting point, California’s criminal gun death rate was much higher than the national average.
- California passed the first of two “three strikes” laws in 1994, which began the process of incarcerating repeat violent offenders.
Thus, none of the decline in California gun deaths is attributable to the state’s gun control laws.
Myth: Background checks reduce gun crime and suicides
Fact: One study contrasting a decade of data between California (after they passed “comprehensive” background checks) and 32 other states (that had not) concluded “found no change in the rates of either cause of death from firearms.” 15 “The study found no net difference between firearm-related homicide rates before and during the 10 years after policy implementation.”
Myth: The Brady Bill caused a decrease in gun homicides
Fact: All violent crime (including gun and non-gun murders) fell during the same period, 1992 to 1997. However, the percent of homicides committed with guns stayed the same. In 1992, 68% of murders were committed with guns; in 1997, it was still 68%. 16 Thus, the decreased gun homicide rate was part of an overall declining crime rate, not an effect of the Brady Bill.
Fact: Gun possession by criminals has risen in the post-Brady years – 18% of state prisoners (was 16% before Brady) and 15% of federal prisoners (was 12% before Brady) were caught with firearms. 17
Fact: The Brady Bill is not enforced. In 2006, of 77,000 Field Office referrals for instant background check violations (25,259 of which NICS identified as buyers with felony records), 0.4% (273) were ever charged with a crime and 0.1% (73) were convicted. 18
Fact: The Brady Bill has so far failed to appreciably save lives. 19
Fact: Violent crime started falling in 1991, three years before passage of the Brady Bill. The Brady Bill did not apply in 18 states, yet violent crime in those states fell just as quickly. 20
Fact: A majority of Americans agree that the bill is worthless. 51% believe the act has been ineffective at reducing violent crime, and 56% believe it has had no impact on reducing the number of homicides in the U.S. 21
Myth: Gun laws are being enforced
Fact: During the Clinton administration, federal prosecutions of gun-related crimes dropped more than 44 percent. 22
Fact: Of the 3,353 prohibited individuals that obtained firearms, the Clinton administration only investigated 110 of them (3.3%). 23
Fact: Despite 536,000 prohibited buyers caught by the National Instant (Criminal Background) Check System (NICS), only 6,700 people (1.25%) have been charged for these firearms violations. This includes 71% of the violations coming from convicted or indicted felons. 24 None of these crimes were prosecuted by the Federal government in 1996, 1997, or 1998. 25
Fact: In 1998, the government prosecuted just eight children for gun law violations. 26 In that same year, there were only:
- 8 prosecutions for juvenile handgun possession.
- 6 prosecutions for handgun transfer to juveniles.
- 1 prosecution for Brady Bill violations.
Fact: Some of the reasons listed for not prosecuting known gun criminals include “minimal federal interest” and “DOJ/U.S. Attorney policy”. 27
Fact: Half of referrals concerning violent criminals were closed without investigation or prosecution. 28
Fact: The average sentence for a federal firearms violation dropped from 57 months to 46 months from 1996 to 1998. 29
Fact: 18-20 year olds commit over 23% of all gun murders. 30 None of these criminals are allowed by law to purchase a handgun, but the Federal government under Clinton rarely enforced this law. 31
Fact: During Project Exile in Richmond, Virginia US and State authorities prosecuted felons caught with guns, using Federal laws that require mandatory imprisonment. The first-year result was a 33% drop in homicides for the Richmond Metro area in a year where the national murder rate was climbing. 32 This shows that enforcement works. According to Andrew McBride of the Richmond Department of Justice, these cases are as easy to prosecute as “picking change up off the street.”
Myth: Federal gun crime prosecutions increased 25%
Fact:
1992: 9,885 BATF referrals for federal firearm purchase violations
1998: 4,391 (a 56% drop)
1999: 5,489 (a fictitious “25% increase”) 33
Fact:
1992: 12,084 BATF referrals for all firearm law violations
1998: 5,620 (a 53% drop)
Myth: The social cost of gun violence is enormous
Fact: Because guns are used an estimated 2.5 million times per year to prevent crimes, the cost savings in personal losses, police work, and court and prison expenses vastly outweighs the cost of criminal gun violence and gun accidents. The net savings, under a worst-case scenario, is about $3.5 billion a year. 34
Fact: Guns are used 65 times more often to prevent a crime than to commit one. 35
Fact: The medical cost of gun violence is only 0.16% of America’s annual health care expenditures. 36
Fact: Drunken drivers killed 15,935 people in 1998 37 while homicides with guns were 12,102 for the same year. Drunken drivers continue to kill people randomly despite a decade of increased strictness and social pressure against drunk drivers.
Myth: The social cost of gun violence is $20-100 billion
Fact: One “study” 38 included the lifetime earnings of people that die from guns, not just the true social costs. This included lost incomes of criminals killed by law-abiding citizens, costs associated with suicides, the “emotional costs experienced by relatives and friends of gunshot victims, and the fear and general reduction in quality of life … including people who are not victimized”. If the same methodology were used to calculate the social savings from private gun ownership, we would see a benefit to society of half a trillion dollars, or 10% of the 1999 US Gross Domestic Product.
Fact: Another “study” 39 started by polling people how much they would be willing to have their taxes raised in order to reduce firearm violence by 30%, and then projected these bids to the entire U.S. population. This seriously flawed methodology does not measure the “cost” of the problem, just what people are willing to spend to reduce the problem.
Fact: Social saving from private ownership is not used in these studies. One study 40 indicated between 240,000 and 300,000 defensive uses of firearms, as described by the victim, “… almost certainly had saved a life.”
Myth: Gun “buy-back” programs get guns off the streets
Fact: A study 41 of 339 buy-back programs in 277 cities over three decades “did little to reduce gun crime or firearm-related violence.” This was due because “most participants in buyback programs tend to be drawn from populations with relatively low crime risks” and “firearms sold in buybacks do not appear to be those that would typically be used to commit gun crime.”
Fact: According to the federal government, gun ‘buybacks’ have “no effect”. 42
Fact: “Buy-backs” remove no more than 2% of the firearms within a community. And the firearms that are removed do not resemble guns used in crimes. “There has never been any effect on crime results seen”. 43
Fact: Up to 62% of people trading in a firearm still have another at home, and 27% said they would or might buy another within a year. 44
Fact: More than 50% of the weapons bought via a gun buy-back program were over 15 years old, whereas almost half of firearms seized from juveniles are less than three years old. 45
Fact: 81% of police surveyed believe buybacks are ineffective in reducing gun violence. 46
Fact: According to a variety of sources, the actual effect is that gun buy-back programs:
- Disarm future crime victims, creating new social costs
- Give criminals an easy way to dispose of evidence
- Acquire guns from those least likely to commit crimes (the elderly, women, etc.)
- Result in cheap guns being bought by private individuals and sold to the government for a profit
- Cause guns to be stolen and sold to the police, creating more crime
- Seldom return stolen guns to their rightful owners
Fact: “They do very little good. Guns arriving at buy-backs are simply not the same guns that would otherwise have been used in crime. If you look at the people who are turning in firearms, they are consistently the least crime-prone [ed: least likely to commit crimes]: older people and women.” 47
Myth: Closing down “kitchen table” gun dealers will reduce guns on the street
Fact: 43% of gun dealers had no inventory and sold no guns at all. Congressional testimony documented that the large number of low-volume gun dealers is a direct result of BATF policy. The BATF once prosecuted gun collectors who sold as few as three guns per year at gun shows, claiming that they were unlicensed, and therefore illegal, gun dealers. To avoid such harassment, thousands of American gun collectors became licensed gun dealers. Now the BATF claims not to have the resources to audit the paperwork monster it created.
Fact: Reforms of the Federal Firearm Licensing program – mainly focused at small volume retailers and traders – produced no significant results in firearm crime rates. 48
Myth: Only the government should have guns
Fact: Only if you want criminals to have them as well. Loose inventory controls are notorious in government agencies, as shown by the Immigration and Naturalization Service (INS) that has “misplaced” 539 weapons, including a gas-grenade launcher and 39 automatic rifles or machine guns. Six guns were eventually linked to crimes (two guns had been used in armed robberies, one was confiscated in a raid on a drug laboratory, two others during arrests and one was being held as evidence in a homicide investigation). 49 In July of 2001, it was reported that the FBI lost 449 weapons, including machine guns.
Myth: “Safe storage” laws protect people
Fact: Fifteen states that passed “safe storage” laws saw 300 more murders, 3,860 more rapes, 24,650 more robberies, and over 25,000 more aggravated assaults in the first five years. On average, the annual costs borne by victims averaged over $2.6 billion as a result of lost productivity, out-of-pocket expenses, medical bills, and property losses. “The problem is, you see no decrease in either juvenile accidental gun deaths or suicides when such laws are enacted, but you do see an increase in crime rates.” 50
Fact: Only five American children under the age of 10 died of accidents involving handguns in 1997. 51 Thus, the need for “safe storage” laws appears to be low.
Fact: In Merced California, an intruder stabbed three children to death with a pitchfork. The oldest child had been trained by her father in firearms use, but could not save her siblings from the attacker because the gun was locked away to comply with the state’s “safe storage” law. 52
Myth: Local background checks reduce gun suicides 53
Fact: The research reports only a change in the “firearm suicide rate” and not the total suicide rate. No strict correlation between overall suicides and background checks exists.
Fact: The report did not explain the disparity between states that had local background checks and radically different suicide rates (Hawaii with 2.82/100,000 and Washington with 9.28/100,000). Nor did it explain how states with different levels of background checks have nearly identical suicide rates (Hawaii has local checks and a 2.82 firearm suicide rate while New York uses state checks and has a lower 2.72 rate).
Fact: The report was a two-year snapshot, which makes trending impossible. Proper analysis would have examined change in suicide rates in states before and after background check policy changed.
Fact: Researchers split homicide and suicide propensity controls by age (65+ for suicides and 15-29 for homicides).
Notes:
- Under the Gun: Weapons, Crime, and Violence in America, Bureau of Alcohol, Tobacco and Firearms estimate and reported via James Wright, Peter H. Rossi, Kathleen Daly, 1983 ↩
- First Reports Evaluating the Effectiveness of Strategies for Prelventing Violence: Firearms Laws, CDC, Task Force on Community Preventive Services, Oct 3, 2003 – a systematic review of 51 studies that evaluated the effects of selected firearms laws on violence ↩
- Violent Encounters: A Study of Felonious Assaults on Our Nation’s Law Enforcement Officers, U.S. Department of Justice, August 2006 ↩
- National Center for Health Statistics, Vital Statistics, Revised July 1999 ↩
- Dr. Gary Kleck, University of Florida using FBI Uniform Crime Statistics, 1997 ↩
- Dr. Gary Kleck, University of Florida using FBI Uniform Crime Statistics, 1997 ↩
- Index of Crime by State, FBI Uniform Crime Reports (UCR) for 2000, p. 79, Table 5 ↩
- FBI Uniform Crime Reports, September 15, 2000 ↩
- FBI Uniform Crime Reports, September 15, 2000 ↩
- Under the Gun, Wright, Rossi, Daly, University of Massachusetts, 1981 ↩
- Under the Gun, Wright, Rossi, Daly, University of Massachusetts, 1981 ↩
- Under the Gun, Wright, Rossi, Daly, University of Massachusetts, 1981 ↩
- Understanding Why Crime Fell in the 1990s, Steven Levit, Journal of Economic Perspectives, Winter 2004 ↩
- Center for Disease Control, WISQARS online Fatal Injury Reports, 2010 ↩
- California’s comprehensive background check and misdemeanor violence prohibition policies and firearm mortality, Annals of Epidemiology, November 2018, Castillo-Carniglia, Kagawa, Wintemute ↩
- FBI Uniform Crime Reports for 1992 and 1997 ↩
- Firearm Use by Offenders, Bureau of Justice Statistics, November 2001 ↩
- Enforcement of the Brady Act, 2006, Regional Justice Information Service, study funded by Bureau of Justice Statistics, Office of Justice Programs, U.S. Department of Justice ↩
- Dr. Jens Ludwig, Dr. Philip J. Cook, Journal of the American Medical Association, August 2000 ↩
- Gun Licensing Leads to Increased Crime, Lost Lives, Prof. John Lott, L.A. Times, Aug 23, 2000, based on both the FBI Uniform Crime Statistics for 1990s and the U.S. Justice Department Crime Victimization Survey ↩
- Portrait of America survey, August 2000 ↩
- Transactional Records Access Clearinghouse (TRAC) at Syracuse University covering 1992 through 1998 ↩
- General Accounting Office (GAO) 2000 audit of the National Instant Check System between 11/30/98 and 11/30/99. This stat needs to be tempered by the fact that many initial rejections were due to database errors – false positives – where the buyer was later approved. ↩
- Bureau of Justice Statistics, Federal Firearm Offenders and Background Checks for Firearm Transfers, June 4, 2000 ↩
- U.S. Justice Department statistics, 1999 ↩
- U.S. Justice Department statistics, 1999 ↩
- Bureau of Justice Statistics, Federal Firearm Offenders and Background Checks for Firearm Transfers, June 4, 2000 ↩
- General Accounting Office report on the Implementation of NICS, February 2000 ↩
- General Accounting Office report on the Implementation of NICS February, 2000 ↩
- United States Treasury and Justice Department Report, 1999 ↩
- Federal Firearm Offenders report, Bureau of Justice Statistics, June 4, 2000 – firearm suspects declined for prosecution by U.S. attorneys … some of the reasons listed for not prosecuting known gun criminals include “minimal federal interest” and “DOJ/U.S. Attorney policy” ↩
- FBI Uniform Crime Statistics, 1999 ↩
- BATF, 1999 ↩
- Suing Gun Manufacturers: Hazardous to Our Health, Sterling Burnett, National Center for Policy Analysis, 1999 ↩
- Taking Dr. Gary Kleck’s estimate of 2.5 million gun defenses each year, divided by the FBI estimates of crimes committed with a firearm. ↩
- Shooting in the dark: estimating the cost of firearm injuries, Max W and Rice DP, Health Affairs, 1993 ↩
- Compiled by Mothers Against Drunk Driving (MADD) ↩
- The Financial Costs of Gun Violence, Linda Gunderson, Annals of Internal Medicine, September 21, 1999 ↩
- Gun Violence: The Real Costs, Ludwig, Cook, 2000 ↩
- Armed Resistance To Crime, Kleck, Gertz, Journal of Criminal Law and Criminology, vol. 86, no. 1, 1995: 150 ↩
- Have U.S. Gun Buyback Programs Misfired; Ferrazares, Sabia, Anderson; National Bureau of Economic Research; 2021 ↩
- Preventing Crime: What Works, What Doesn’t, What’s Promising, National Institute of Justice, July 1998 ↩
- Garen Wintemute, Violence Prevention Research Program, U.C., Davis, 1997 ↩
- Jon Vernick, John Hopkins Center for Gun Policy and Research, Sacramento and St. Louis studies ↩
- District of Columbia buyback program, 1999 ↩
- Gun Policy & Law Enforcement survey, PoliceOne, March 2013 ↩
- David Kennedy, Senior Researcher, Harvard University Kennedy School Program in Criminal Justice, in appearance on Fox News, November 22, 2000 ↩
- Christopher Koper of Pennsylvania’s Jerry Lee Center of Criminology, reported in Criminology & Public Policy, American Society of Criminology, March 2002 ↩
- Associated Press report, April 17, 2001 ↩
- Safe Storage Gun Laws: Accidental Deaths, Suicides, and Crime, Prof. John Lott, Yale School of Law, March 2000 ↩
- Safe Storage Gun Laws: Accidental Deaths, Suicides, and Crime, Prof. John Lott, Yale School of Law, March 2000 ↩
- Sierra Times and various wire services, September 2000 ↩
- This myth derives from Firearm Death Rates and Association with Level of Firearm Purchase Background Check, Steven A. Sumner, Layde, Guse, American Journal of Preventive Medicine, Volume 35, Issue 1, Pages 1-86 (July 2008) ↩