
Myth: 30,000 people are killed with guns every year.
Fact: 61% of these deaths are suicides 1 (80% in Canada 2). Numerous studies have shown that the presence or absence of a firearm does not change the overall (i.e., gun plus non-gun) suicide rate. This 30,000 number also includes justifiable homicides (self-defense) and accidents.
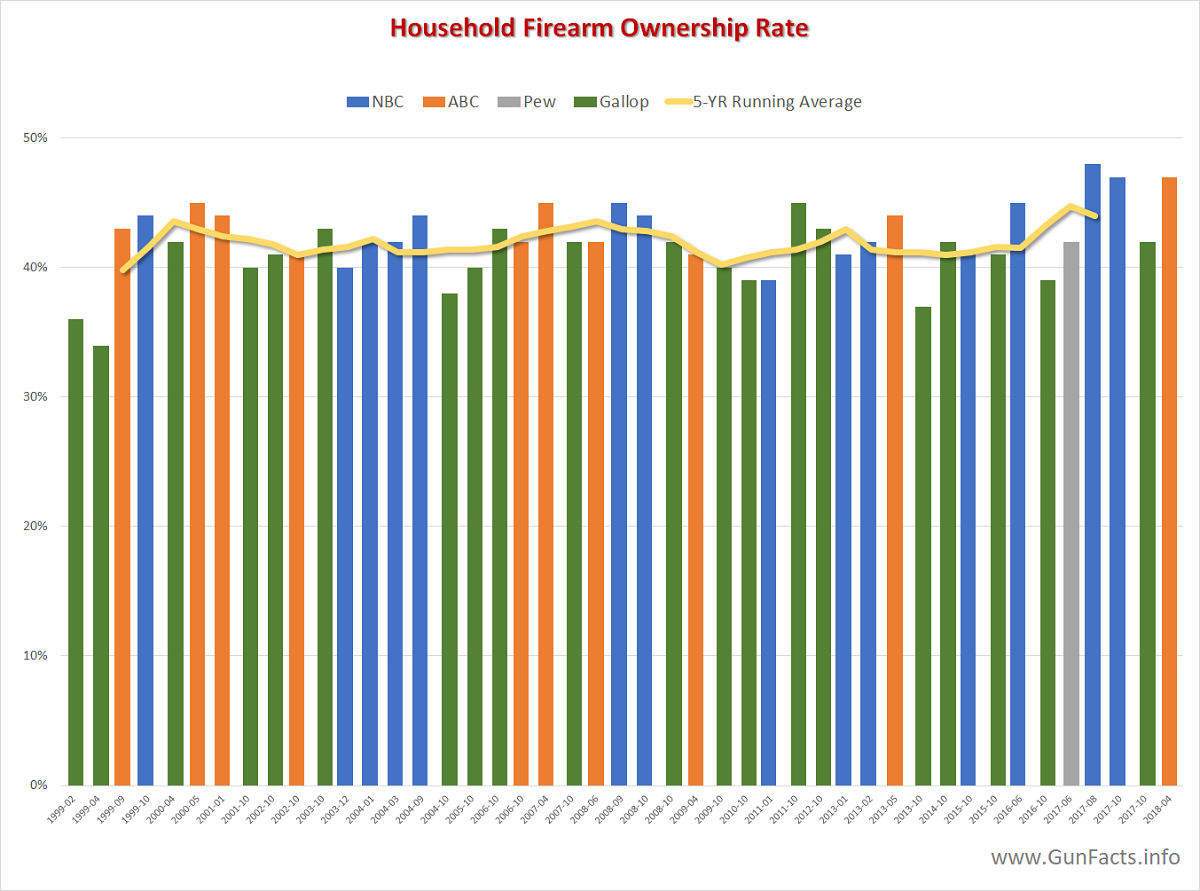
Myth: Gun ownership is falling in the United States
 |
|||||||||||||||
|
|||||||||||||||
 |
|||||||||||||||
 |
|||||||||||||||
 |
Fact: All three of the long-term tracking polls show show a consistent or slightly rising household firearm ownership rate. A forth poll, after changing their methodology, fell into alignment with the other three.
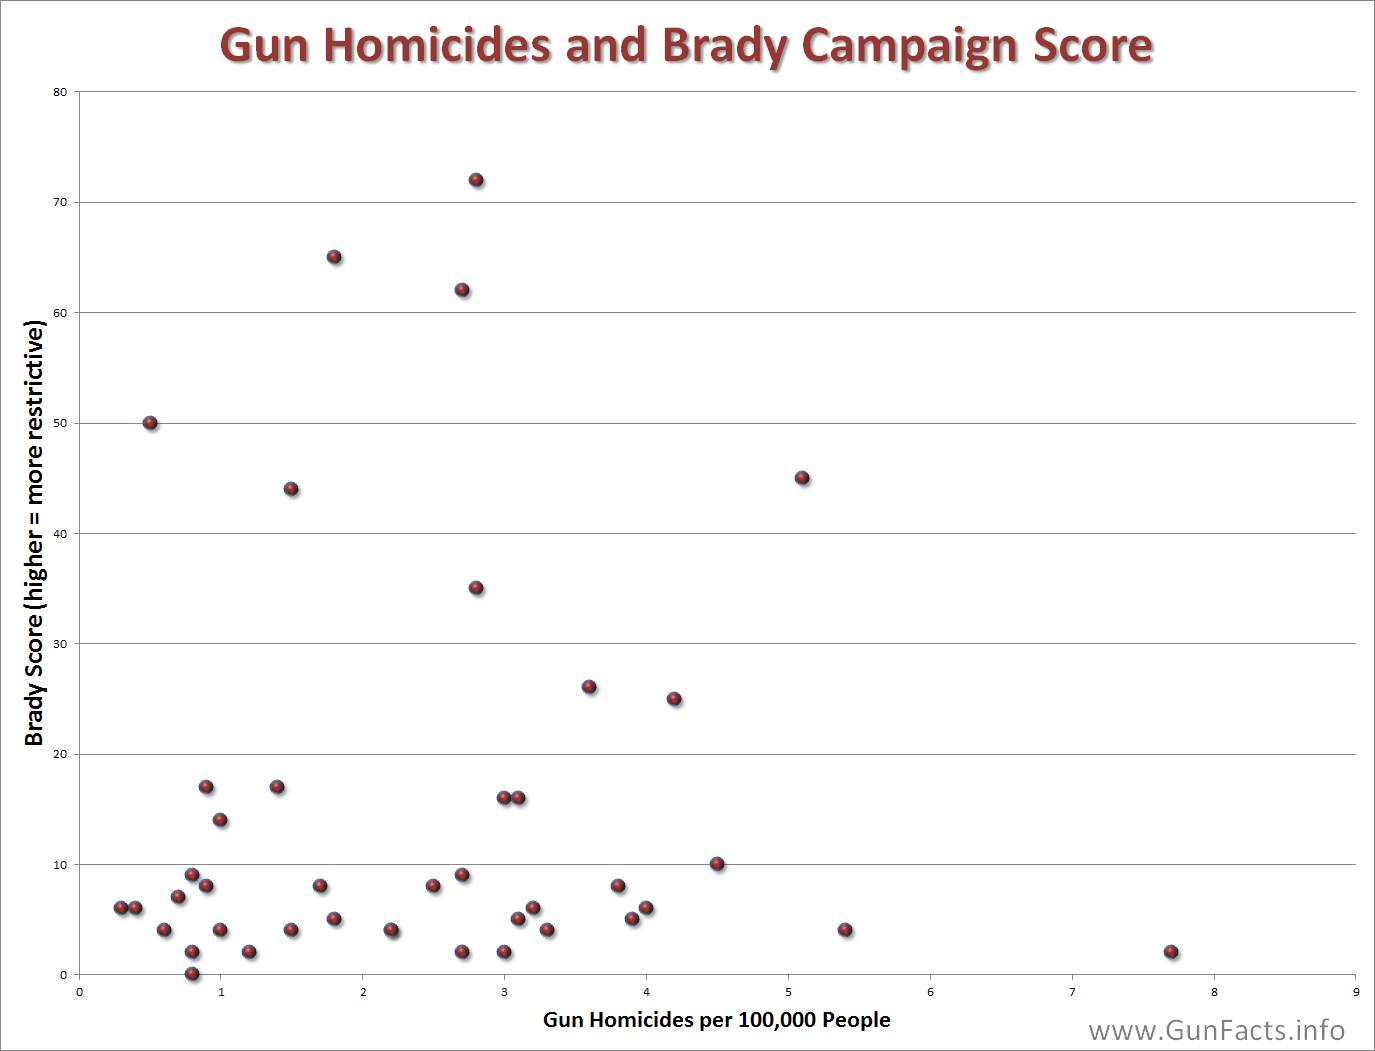
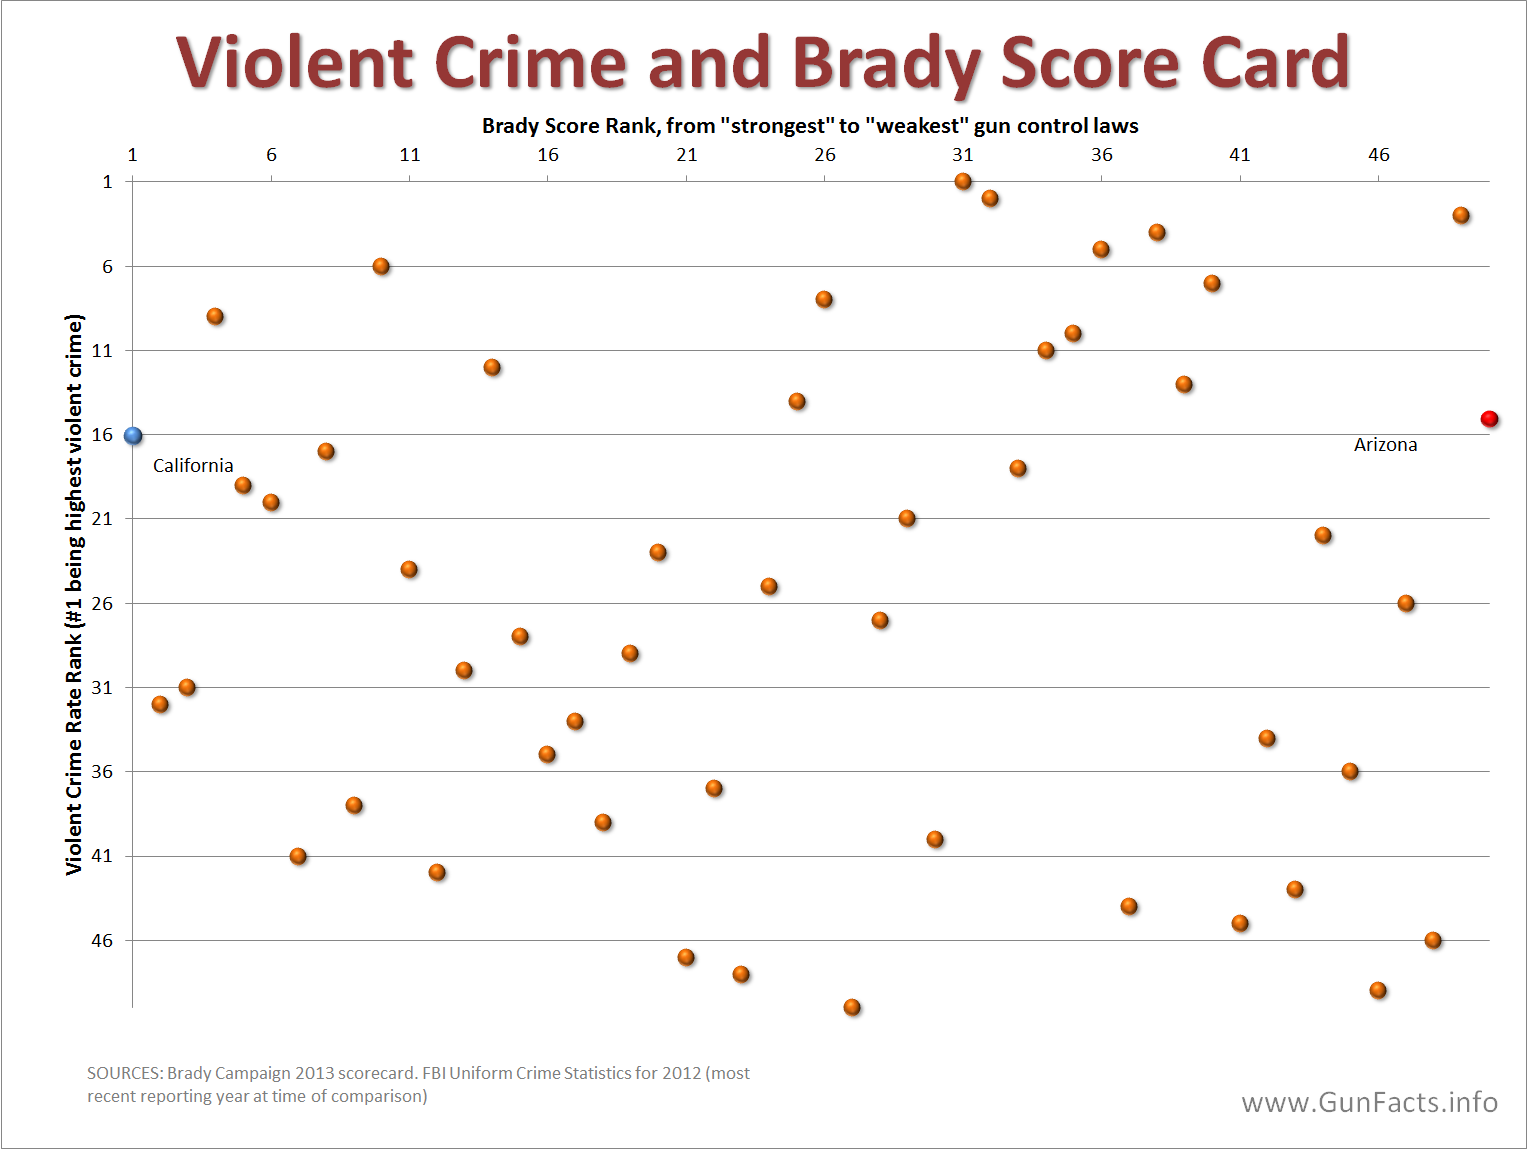
Myth: The Brady Campaign has a good ranking system of state gun control laws.
Fact: Two surveys (ABC and Gallup) consistently showed household ownership rates remaining steady over multiple decades. Two others (Pew and GSS) showed ownership dropping. The former reported on registered voters, who have to be citizens to vote in federal elections. The latter polled everyone regardless of citizenship status. With the non-citizen population growing 37% in less than 30 years, and now claiming about 11% of the total population, this is a key differentiator. Pew changed their methodology in 2017, and their estimate is now in line with the other three surveys.
Fact: There is zero correlation between the letter grades given by the Brady Campaign and the violent crime or murder rate in those states, making the Brady grade irrelevant (see chart at right). 3
Fact: The states that the Brady campaign rank first and last have nearly identical violent crime rates.
Myth: 1,000 people die each day from guns
Fact: 25% of this unreliable figure 4 includes “direct war deaths,” and another 14% are suicides. The bulk of the rest come from violence-prone and near-lawless localities.
Fact: The source for this raw data admits, “A complete dataset on people killed in conflict—directly or indirectly—does not exist. All published figures are estimates based on incomplete information.” 5
Fact: Indeed, the definition of “gun” seems to be very broad: “… revolvers and self-loading pistols, carbines, assault rifles, sub-machine guns, and light machine guns.” Light weapons are “… heavy machine guns, hand-held under-barrel and mounted grenade launchers, portable antitank and anti-aircraft guns, recoilless rifles, portable launchers of anti-tank and antiaircraft missile systems, and mortars of less than 100mm caliber.” And they admit to the problem of a broad definition: “The Survey uses the terms ‘small arms,’ ‘firearms,’ and ‘weapons,’ interchangeably. Unless the context dictates otherwise, no distinction is intended between commercial firearms (e.g. hunting rifles), and small arms and “light” weapons designed for military use (e.g. assault rifles).” 6
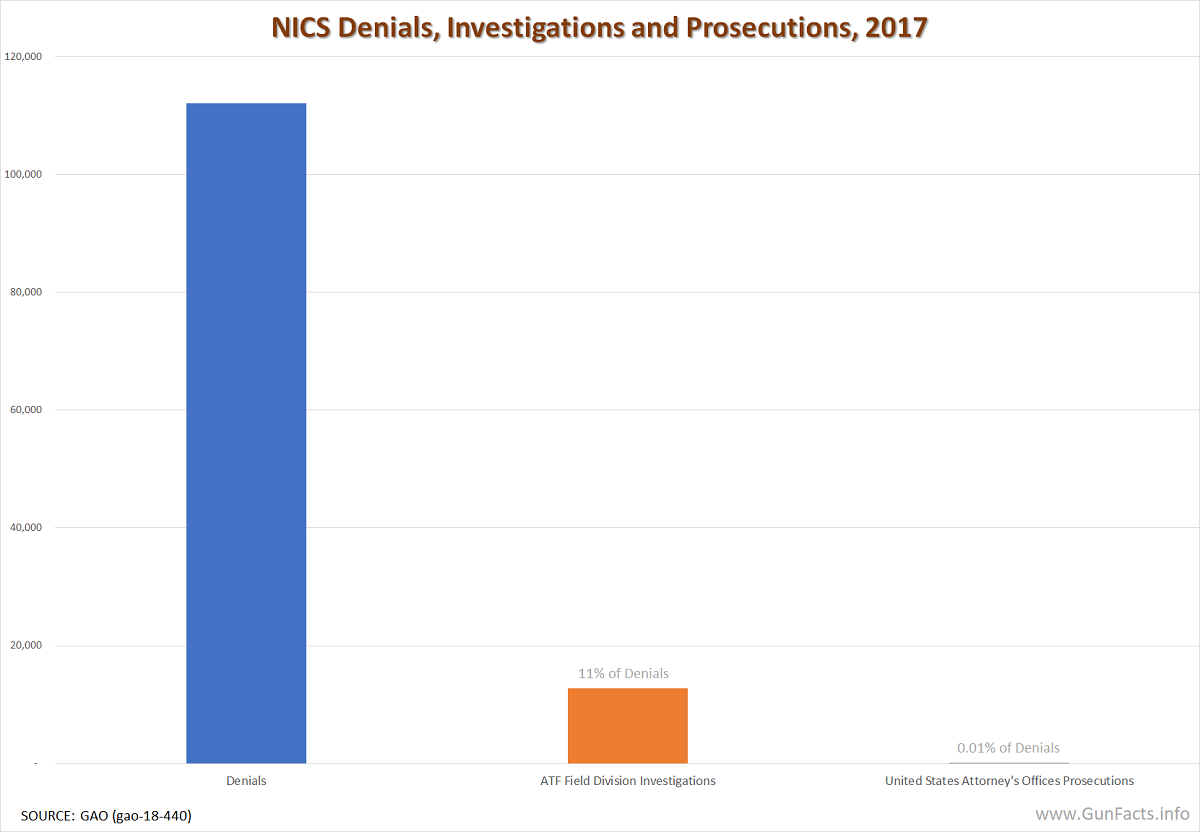
Myth: Background checks stop crimes
Fact: A review by the General Accounting Office (GOA) shows that few denials are actually forwarded to federal agencies for prosecution, and almost none are actually prosecuted. The same report says that 10 of 13 selected states said they did not investigate or prosecute any firearm denials. This despite 72% of appealed denials staying in force.
Myth: High-capacity magazines lead to more deadly shootings
Fact: Much of this myth comes from the fact that the general availability of high-capacity handguns briefly preceded the rise in the crack cocaine trade, which brought a new kind of violence in local drugs wars. 7
Fact: The number of shots fired by criminals has not changed significantly even with the increased capacity of handguns and other firearms. Indeed, the number of shots from revolvers (all within 6-8 round capacity) and semi-automatics were about the same – 2.04 vs. 2.53. 8 In a crime or gun battle, there is seldom time or need to shoot more.
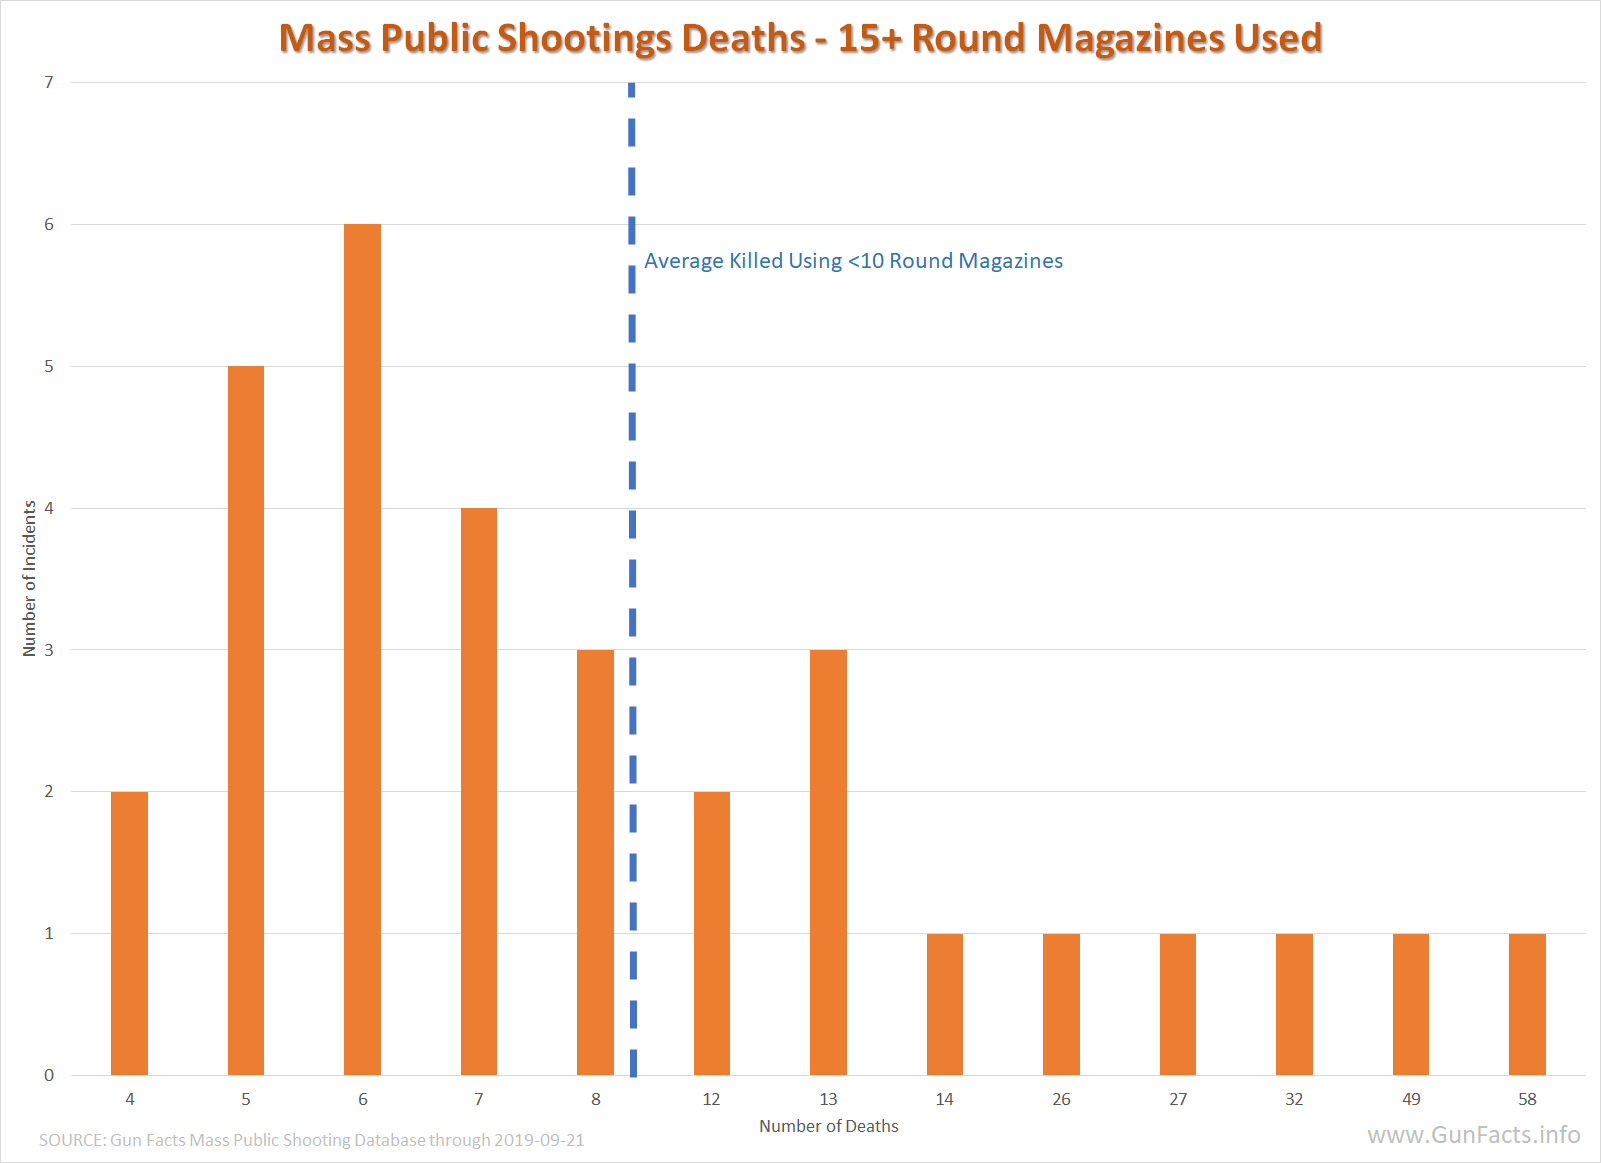 Fact: For mass public shootings the cluster of deaths per incident show that (a) the number of available victims is the key factor in deadliness and (b) a small number of one-time, high-end events (all Cattle Pen Scenarios) are the primary factor.
Fact: The average magazine swap time for a non-expert shooter is 2-3 seconds. In the case of the Newtown Sandy Hook massacre, the murderer performed 10 magazine changes, or about 30 of the ~600 seconds that lapsed from him entering the building to when the police arrived. A 10-round restriction would have raised it to only 46 seconds and thus would have saved nobody.
Fact: Firearm homicides declined from 6.3 to 4.2 (per 100,000 population) from 1981 through 1998, when the increase in semi-automatics and large capacity handguns were rising at a fast rate. 9 Fatal shootings of police officers declined sharply from 1988 through 1993. 10
Fact: Drug dealers tend to be “more deliberate in their efforts to kill their victims by shooting them multiple times.” 11
Myth: “Universal” background checks will reduce crime
Fact: California’s comprehensive background check “was not associated with a net change in the firearm homicide rate over the ensuing 10 years in California.” 12
Fact: With nearly 40% of crime guns coming from black-market street dealers peddling stolen and recycled guns, and another 40% coming from “acquaintance” purchases 13 (friends, other criminals, illegal straw sales) expanded background checks won’t stop these already off-the-radar transfers.
Fact: Police don’t think so – 80% surveyed reject the notion. 14
 Myth: Homicides went up when Missouri repealed their permit-to-purchase (licensing) law

Fact: The homicide rate in Missouri has actually dropped in that period, according to the FBI’s Universal Crime Reporting data. 15
Myth: Connecticut’s permit and background law caused homicide to fall by 40% 16
Fact: This “study” did not use historical homicide data. Instead it created a statistical model of a “synthetic Connecticut” that was comprised using 72% of Rhode Island’s data. It is also worth noting that Connecticut’s homicide rate was already in free-fall before the law was passed, dropping 27% from its high in 1993.
Myth: The “powerful gun industry” stops all gun control legislation
Fact: The firearms industry is composed of “small, marginally profitable companies,” with combined revenues of $1.5 billion to $2 billion per year, making it politically ineffective. 17
Fact: Total political contributions from firearm industry members, PACs and employees was under $4.4 million in the 2002 election cycle, which made the industry the 64th ranked contributor. Compare that to $33 million from the American Federation of State, County & Municipal Employees. 18
Fact: Perhaps the “gun industry” being referenced is the 100+ million adults who peacefully own firearms and do not want their civil rights restricted.
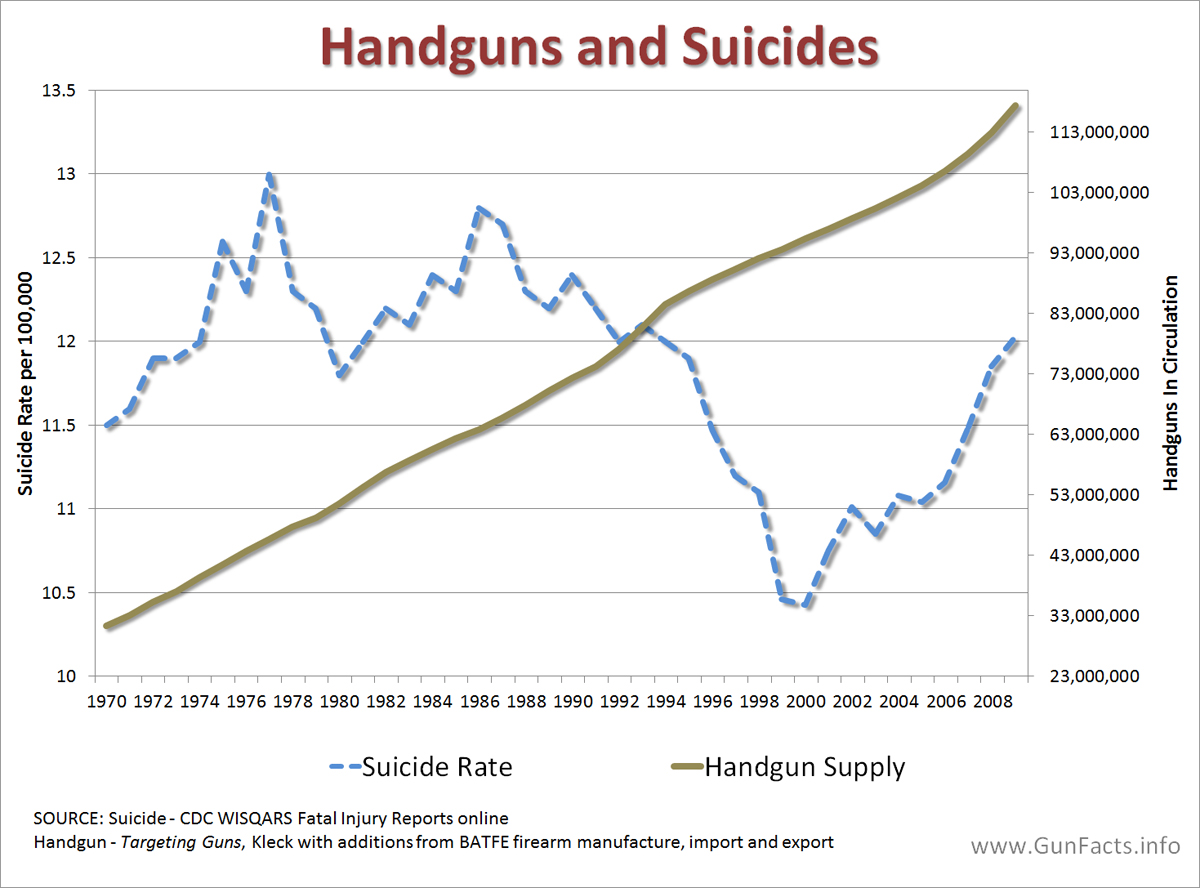
Myth: Access to guns increases the risk of suicide
Fact: The rate of suicide is not affected by the presence of a firearm. This is true in either a time-series analysis (like the chart at right showing the change in handgun supply in the U.S. over time), 19 or through cross-national analysis. For example, Japan has no private handgun ownership (aside from an extremely limited number of licensed Olympic sport shooters), and yet had a suicide rate more than twice that of the United States in 2002. 20
Fact: The claim derives mainly from one study 21 which has some serious methodology problems including unbalanced high/low state counts, inclusion of Hawaii (a known outlier) and intermixing mental health and drug use as confounding variables.
Myth: States with background checks and waiting periods have lower suicide rates
Fact: This study (“Handgun Legislation and Changes in Statewide Overall Suicides Rates“) had significant methodology flaws, including being a time-series study covering just one year and omitting a number necessary variables.
Myth: States With The Most Gun Laws See The Fewest Gun-Related Deaths
Fact: This study 22 includes suicides, which account for approximately 2/3rd of “gun deaths”. As has been shown before, gun availability does not change the probability of a successful suicide.
Myth: Individuals who commit suicide are more likely to have had access to guns 23
 Fact: This is a classic causal effect. If someone decides to commit suicide, and they choose to use a gun, they will first acquire a gun. As noted before, the total rate of suicide does not change when a gun is present because the victim will choose a different method.
Myth: The only purpose for a gun is to kill people
Fact: Guns are used for self-defense 2,500,000 times a year in the United States. 24
Fact: Guns are used as a deterrent to crime even when no rounds are fired. 25
Fact: Guns are used in sports including hunting, target practice, practical pistol, scenario simulation, skeet, etc.
Myth: 89% of mayors want congress to create tougher gun control laws
Fact: This famously flawed survey (which the publication admitted was not scientific), cherry picked a full 76% of the respondents from the Michael Bloomberg gun-control group Mayors Against Illegal Guns.
Notes:
- Center for Disease Control, WISQARS Fatal Injury Reports ↩
- Death Involving Firearms, Kathryn Wilkins, Health Report vol. 16, no 4, Statistics Canada. ↩
- 2012 Brady Campaign Scorecard, Center for Disease Control firearm homicides statistics ↩
- Bringing the global gun crisis under control, IANSA, 2006 citing Small Arms Survey. ↩
- Small Arms Survey 2005, www.smallarmssurvey.org. ↩
- Small Arms Survey 2002, www.smallarmssurvey.org. ↩
- Targeting Guns, Gary Kleck, Aldine Transaction, 1997. ↩
- Urban firearm deaths: A five-year perspective, Michael McGonigal, John Cole, William Schwab, Donald Kauder, Michael Rotondo, Peter Angood, Journal of Trauma, 1993. ↩
- Center for Disease Control WISQARS. ↩
- Firearm injury from crime, Marianne Zawitz, 1996, Bureau of Justice Statistics. ↩
- Epidemiological changes in gunshot wounds in Washington D.C, Webster, Champion, Gainer and Sykes, Archives of Surgery, 1992. ↩
- California’s comprehensive background check and misdemeanor violence prohibition policies and firearm mortality, Castillo-Carniglia, Annals of Epidemiology, October 2018 ↩
- Firearm Use by Offenders, Bureau of Justice Statistics, February 2002. ↩
- Gun Policy & Law Enforcement, PoliceOne, March 2013 ↩
- FBI, Uniform Crime Reports, online database ↩
- Association between Connecticut’s permit-to-purchase handgun law and homicides, Webster, Stuart, Vernick, Rudolph, Johns Hopkins Center for Gun Policy and Research, 2015 ↩
- New York Times, Mar. 18, 2000. ↩
- OpenSecrets.org, May 2003. ↩
- FBI Uniform Crime Statistics online, BATFE Firearm Commerce Report for 2002. ↩
- FBI Uniform Crime Statistics, World Health Organization Suicide Prevention country reports (online). ↩
- Household Firearm Ownership and Rates of Suicide Across the 50 United States, Miller, Steven, Lippmann, Azrael, Hemenway, Journal of Trauma, April 2007 ↩
- The States With The Most Gun Laws See The Fewest Gun-Related Deaths, Nation Journal, January 2016 ↩
- Mental Illness, Previous Suicidality, and Access to Guns in the United States, Ilgen, Zivin, McCammon, Valenstein, 2008 American Psychiatric Association. ↩
- Targeting Guns, Gary Kleck, Aldine Transaction, 1997 ↩
- Targeting Guns, Gary Kleck, Aldine Transaction, 1997 ↩