
Gun Injury Deep Dive
Gun homicides are a problem, but so are non-fatal gun injuries from assaults. Yet diving into that data shows the causes are likely the same.
Take-aways
- Non-fatal gunshot wounds tend to skew to the same demographics as gun homicides.
- The data is likely an undercount due to the same factors.
The Problem
A lot of people get shot and don’t die.
Estimates vary a bit, but between sources like Nationwide Emergency Department Sample (NEDS) data and CDC “Fast Facts,” there are between 73,000 and 85,000 hospital emergency department visits for non-fatal gunshot injuries. On the high end, the Centers for Disease Control’s WISQARS website says there were 142,143 violence related non-fatal firearm injuries.
But that’s just people who sought hospital medical attention. It does not include visits to urgent care, under-the-radar care (doctors with revoked licenses, veterinarians working on people, off-duty nurses, etc.). Let’s toss the outliers and just say 80,000+ for the sake of simplicity.
In 2023, there were 17,927 firearm homicides. If all 80,000+ non-fatal gunshot wounds were from assaults, then injuries would be 4X that of homicides. But in the 80,000+ are accidents (a tiny number, though some “accidents” were not), self-harm (also tiny since most of these attempts go to the morgue, not the hospital), and even fewer legal interventions.
So, the 4X multiplier (actually 4.5 to be precise) is at least a solid ballpark estimate of the difference between gun homicides and assault-related gun injuries.
The Data
Before jumping into the charts and stuff, note that we used an atypical data source. As such, it only allows for national projections of statistics. No state or county level projections are possible. Though the data is well sourced and calculations made for projections are sound, this is not a census (see the last section titled “Data Source Notes” for the details).
Data Against Expectations
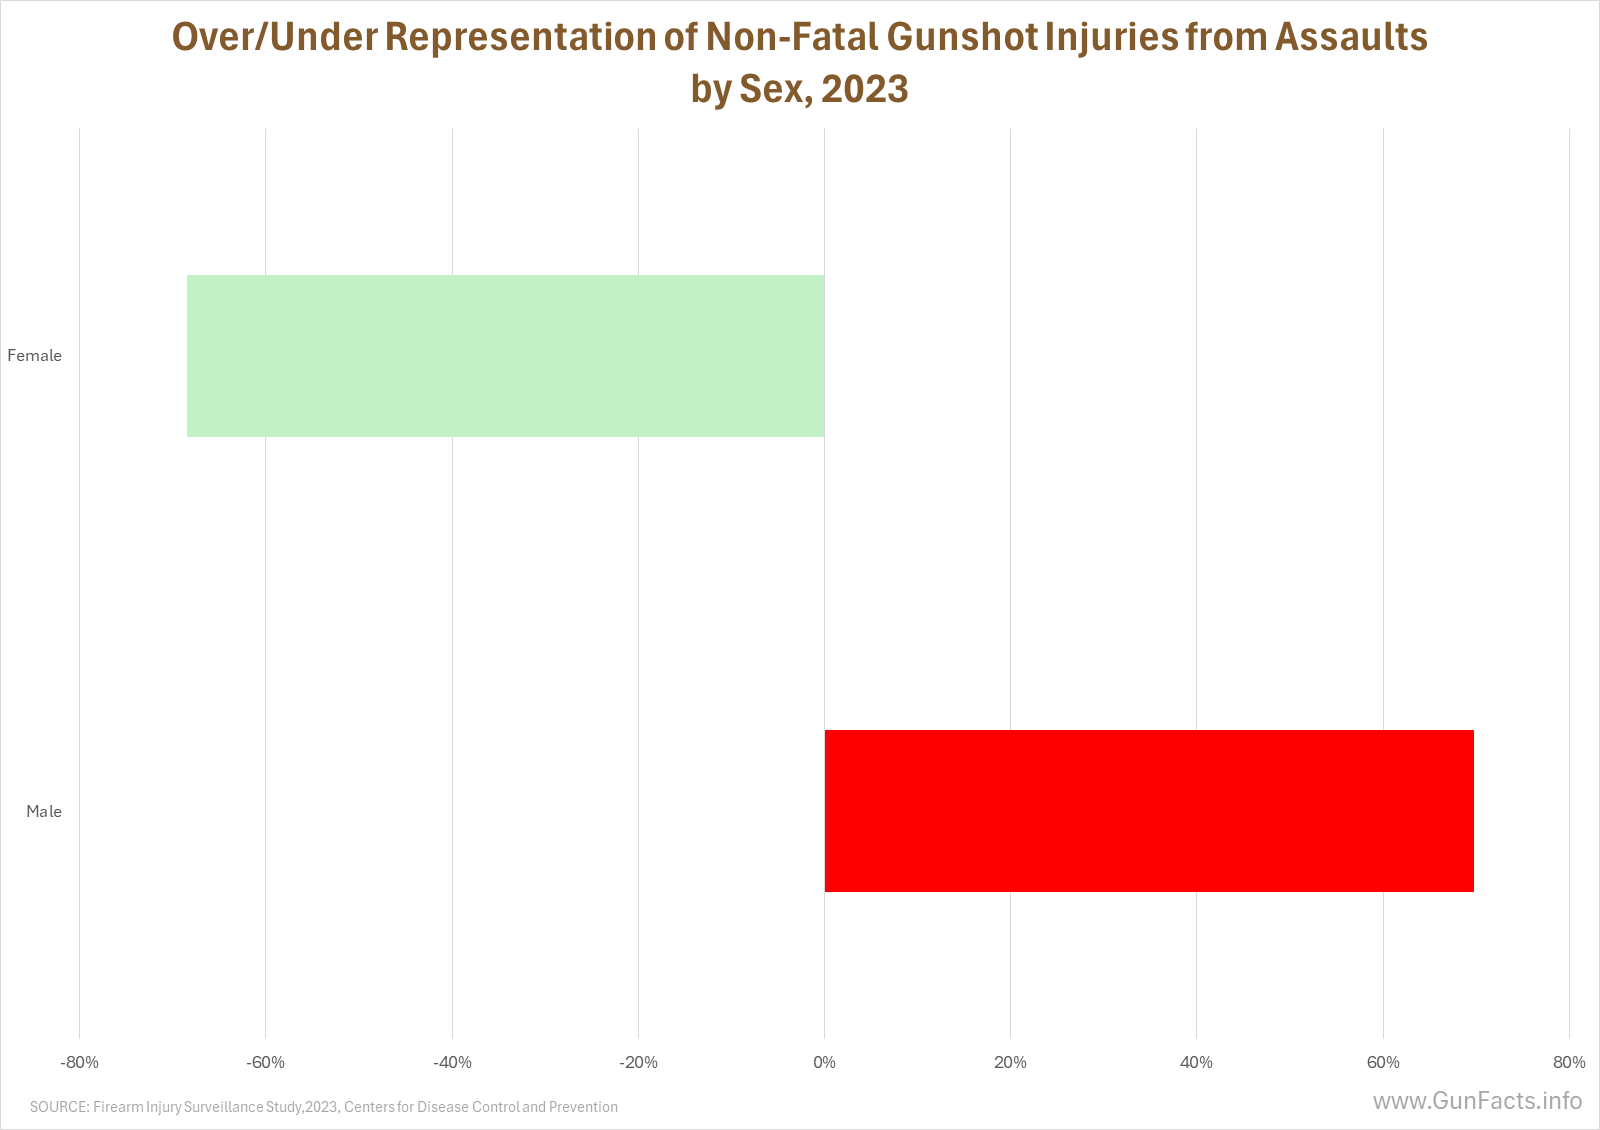
All other things being equal (which they never are), the rate of firearm 1 gunshot injuries should match the population. For example, women make up 50.5% of the population, so all other things being equal (which they are not) they should suffer 50.5% of all gunshot wounds.
They don’t.
Where possible, we look at the divergence between a data point’s population and the rate of firearm gunshot injuries. We express these as the rate that is under or over the population percentwise.
 |
 |
 |
 |
 |
 |
Since we started with women… they prove themselves once again to be smarter than men and avoid violence. Looking at just firearm gunshot injuries from assaults, we see that women are underrepresented for such injuries at a rate about equal to men being overrepresented. Violence is generally a man’s sport, and quadruply so for male street gang members. Hence, women (even if they associate with gangs) are less likely to catch a bullet.
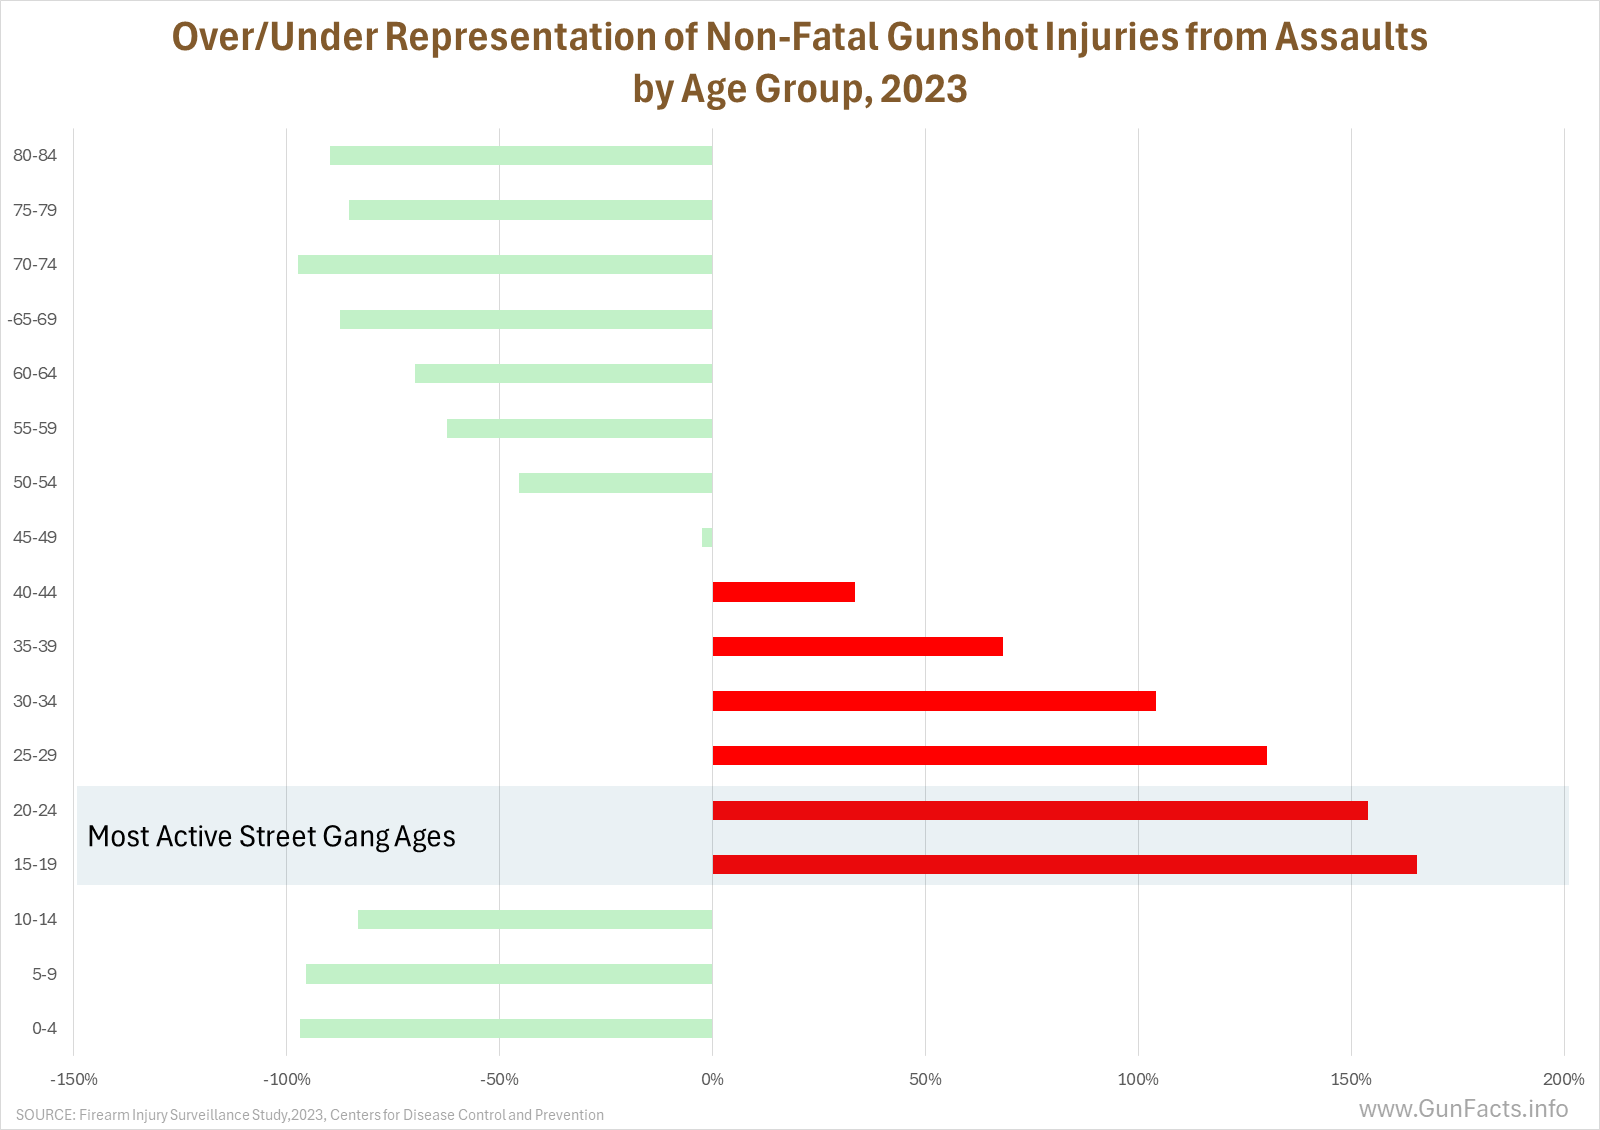
We also know from decades of criminology literature that violence is especially a young man’s game. Outside of the 15–44-year age brackets, most every age group is underrepresented in emergency rooms catering to gunshot victims.
And that is where street gangs come in. We won’t pretend that all the red lines are gang-associated gunshot injuries. After all, most gang members are not active in their early 40s. But we know from the National Gang Center that street gang recruitment starts at age 14 and that the most “active” ages for gang activities are between 14 and 24 (by “active” we mean participating in gang activities that accomplish gang objectives). Some members continue on throughout their 20s and 30s… at least, many survivors do.
The National Gang Center notes that the four primary demographic elements of gang membership are sex (male), age (14–24), urbanicity, and race. The data we explore herein does not provide insight into urbanicity (it only tracks the size of the reporting hospitals, which might be a proxy for urbanicity, but not one we feel safe using). But it does track race.
And this is unsettling.
We have long understood that street gang activity strongly correlates with race. But that is incomplete because culture is the primary indicator of any group’s acceptance of violence as a means to ends.
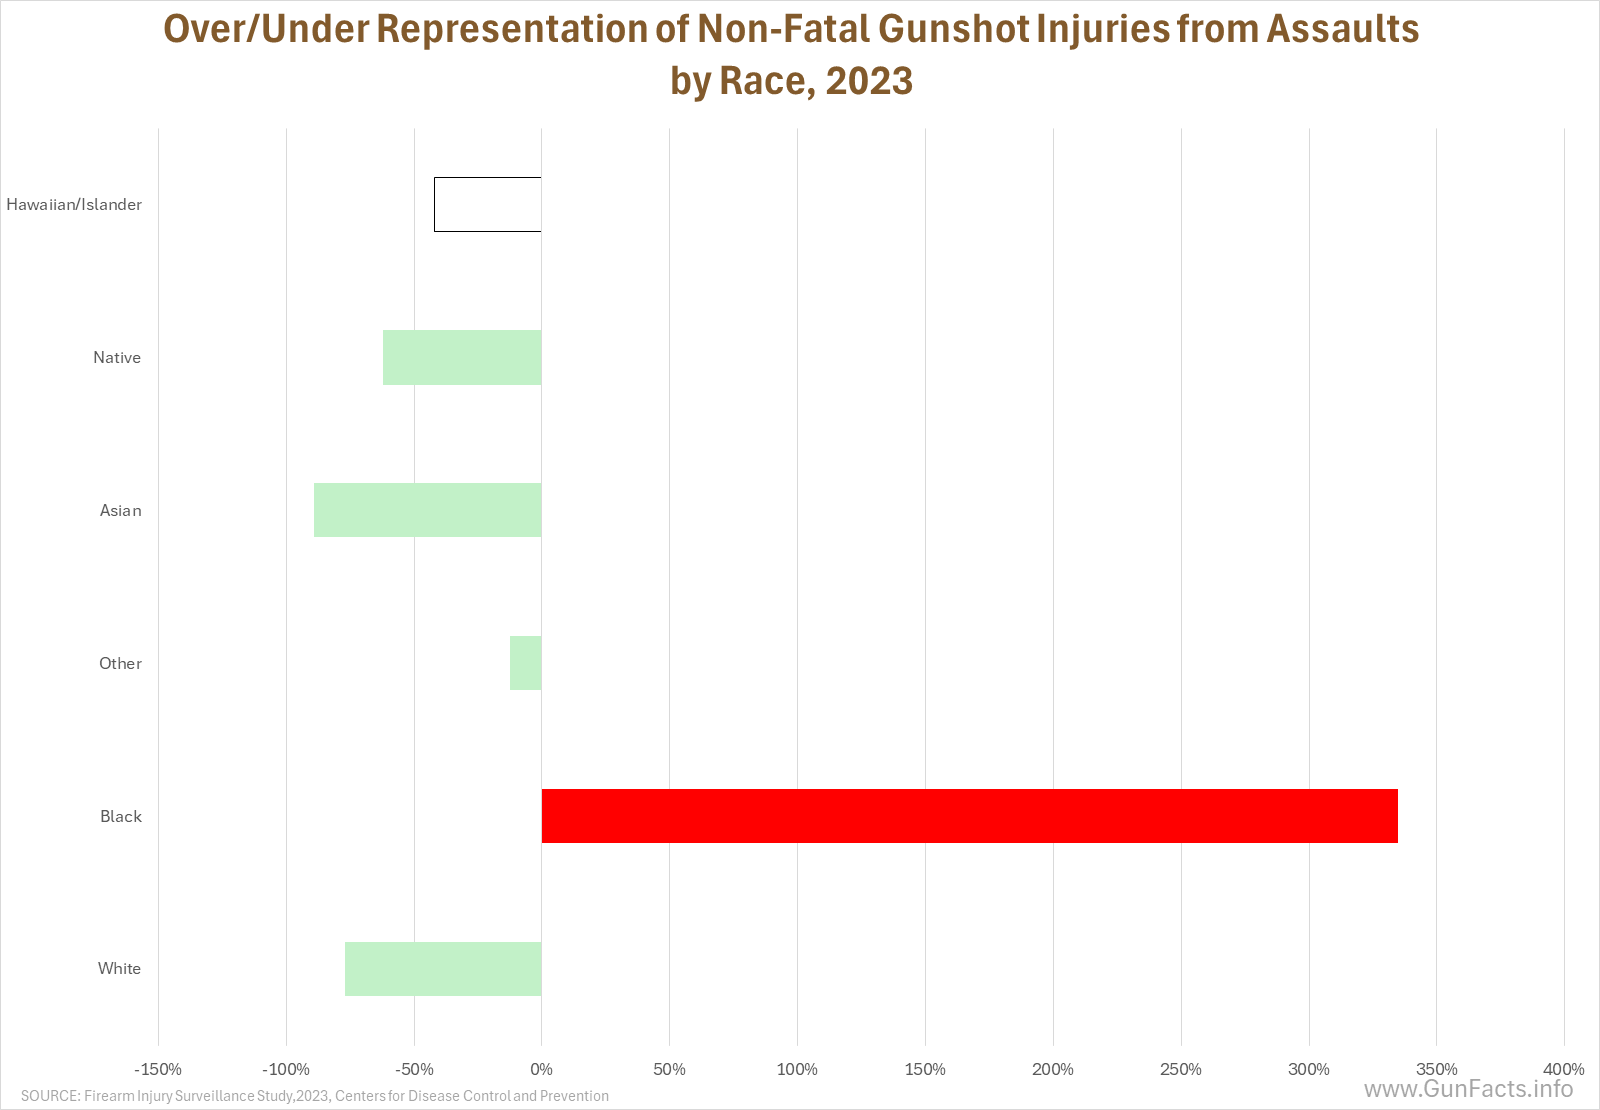
Here we see the divergence in two charts. Foremost, all races except for blacks are underrepresented in non-fatal gunshot injuries. Blacks are astronomically overrepresented. This comports with our previous charting of victim data which shows young black males are proportionately the main victims of firearm homicides.
Every race has gangs (whites have skinheads and the Aryan Brotherhood, Asians have the Asian Boyz, etc.). But the culture in each gang concerning unilateral and reciprocal violence is different. Black gangs in America have a “fatality first” mantra, at least where it concerns inter-gang conflict.
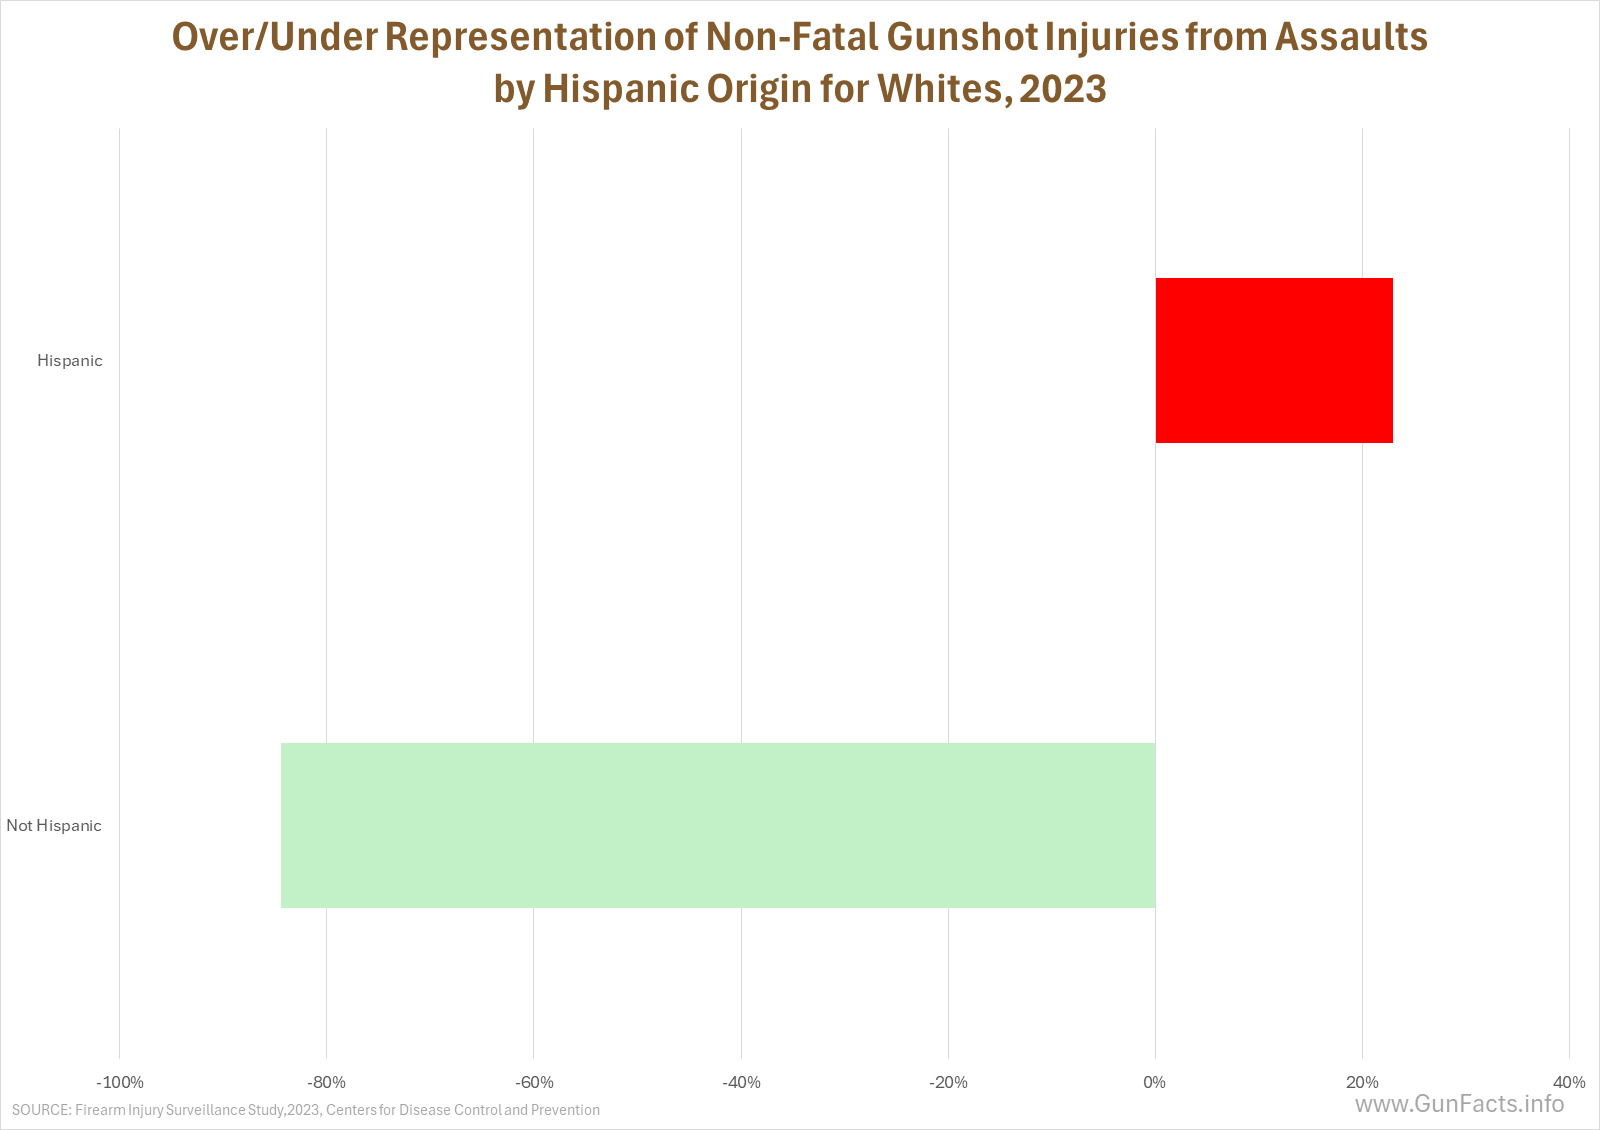
An important distinction concerning Hispanics needs to be made here. Street gangs globally are strongly tied to immigrant populations. The United States has an annual influx of Hispanic people, which both the FBI and CDC define as “persons of Cuban, Mexican, Puerto Rican, South or Central American, or other Spanish culture or origin, regardless of race.” A quick look at white victims subdivided as Hispanic and “white alone” (the government’s parlance, not ours) shows that there is greater violence within Hispanic communities, but at an overage rate of only 23%, which is trivial when compared to the 335% rate for blacks.
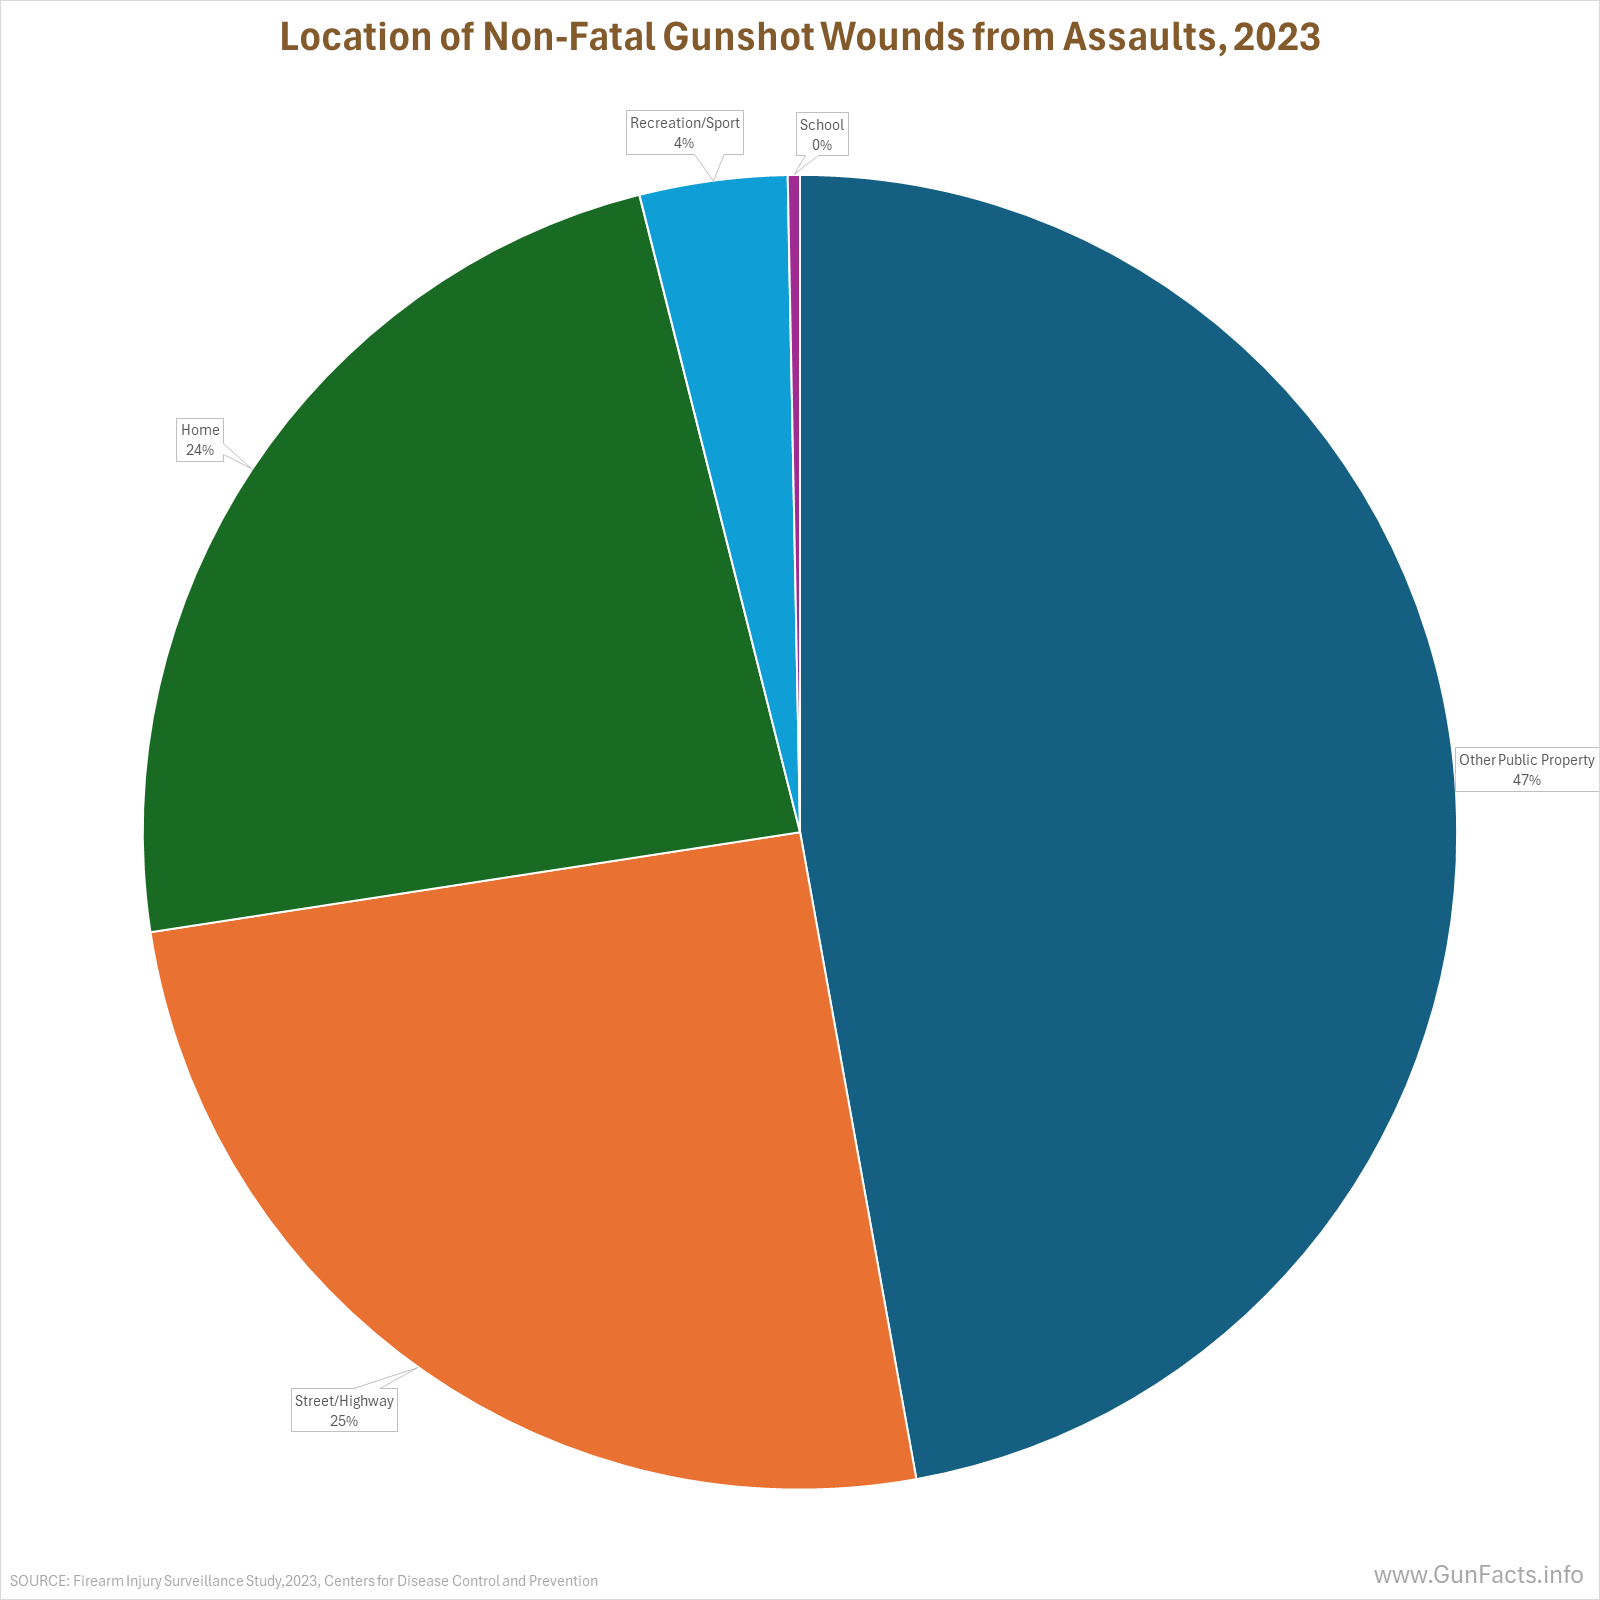
As businessmen like to say, “location, location, location!” So it is with gunshot injuries as well.
We have noted elsewhere that most street gang violence occurs in public (“on the streets,” is you will). The data for non-fatal gunshot injuries validates this yet again. For assaults, the combined locations of “streets” and “other public property” (i.e., parks) is a whopping 72% of the known locations.
Known. Hospitals are not police departments. They gather some information casually. That is why this data collection doesn’t record location for 58% of all assault-related firearm injuries. Given the data and methodologies of the system, this one set of stats is suspect, as it is also not well aligned with police reporting (see our “Gun Violence Audit – 2025” study).
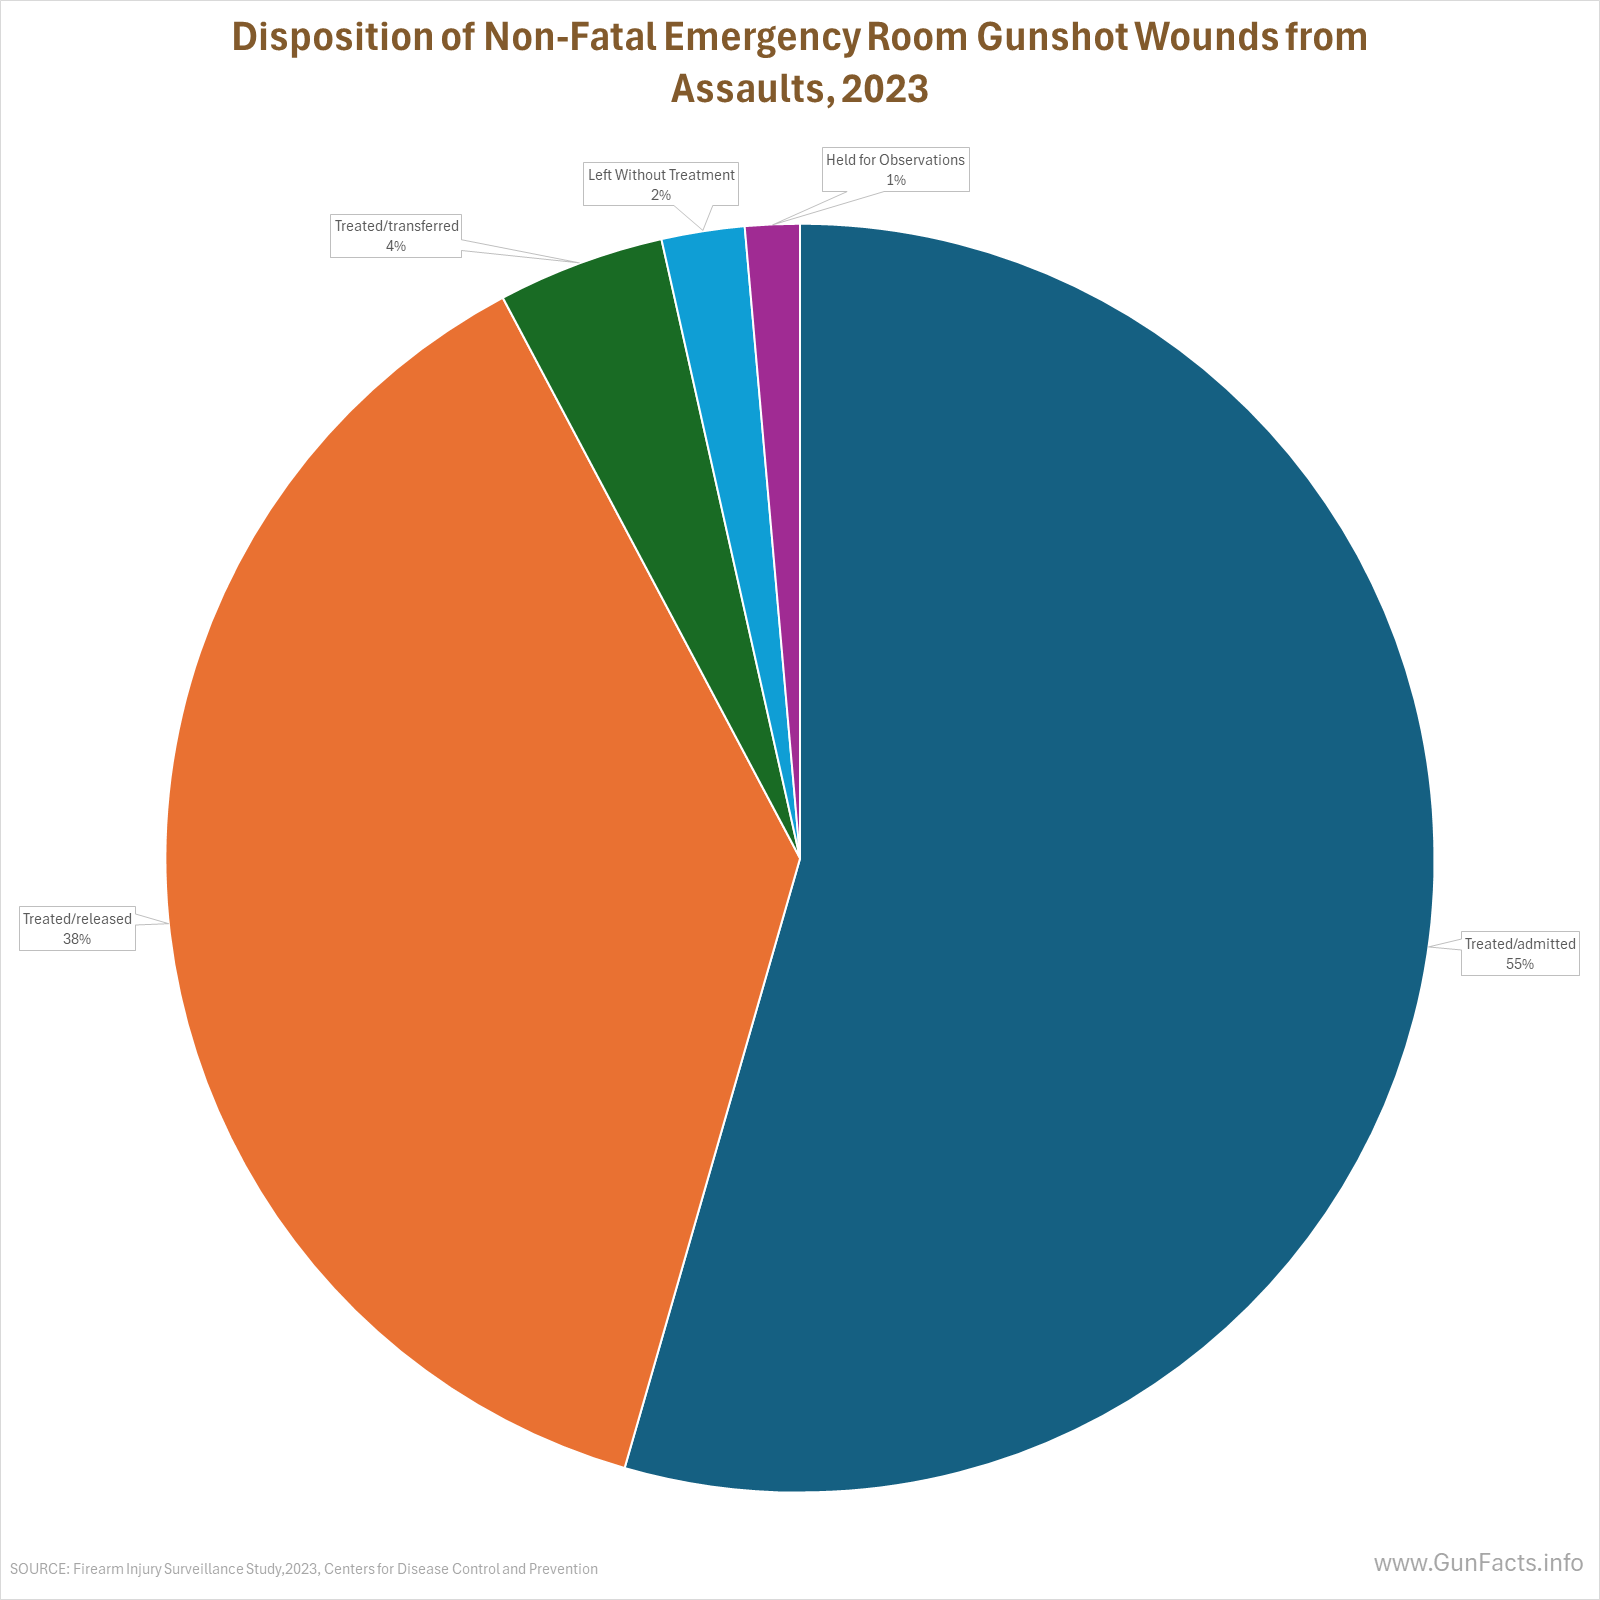
What hospitals do diligently report on is how the victim was treated (or not). Most were admitted into the hospital from the emergency department, which indicates the severity of the injuries and also the healthcare cost involved.
But a fair number (38%) had injuries minor enough to be treated and then released, and another 2% simply left without treatment (we will assume their injuries were not too serious).
It is the first group that is a concern from a policy standpoint. The Government Accountability Office (which sounds like an oxymoron) estimated way back in 2017 that the direct taxpayer cost for treating gunshot injuries, mainly via Medicaid, was about $1 billion. They also note costs to the providers that are not covered were likely an additional 20%. The Journal of the American Medical Association (who are gun policy activists, so take their estimates with ample salt) was $1.3 billion per year over their six-year analysis.
But that is the baseline. Not reported are direct costs to the hospitals for uninsured and deadbeat victims. It also includes only emergency room visits and admissions and thus excludes after-care expenses. In short, it is not the biggest budget item for government, but a byproduct largely of bad actors.
Data Source Notes
The data source for this rant review is “Firearm Injury Surveillance Study,
2023” (ICPSR 39644). The results are cautionary due to the systems design.
The raw data comes from the National Electronic Injury Surveillance System (NEISS). The sample is about 100 well-chosen hospitals of various sizes and locations, selected so a reasonable projection of nationwide stats could be created.
Foremost, it is not a census like the FBI’s National Incident-Based Reporting System (NIBRS). As such, some weighting of data was necessary to take a lot of data from a few sources to align with national demographics. Hence, the numbers are ballpark estimates for the country.
This is also why no state (much less county) estimates can be drawn from the data.
One annoying data defect is that for incidents with unknown or undetermined intent, the intent is classified instead as “unintentional.” The medical community has some very odd logic here. They believe that (from a public-health standpoint) it is less “harmful” to under-classify intentional injuries than to mislabel ambiguous cases.
Bovine excrement in our opinion. There is nothing methodologically incorrect about saying “Intent unknown.” Classifying them as “unintentional” artificially inflates that category, and that is harmful in terms of public understanding of the problems. In our analysis we stuck to incidents resulting from assaults, which bypassed this defect in the data.
Notes:
- The data also included BB gun injuries, and we filtered those out, looking at only firearms. ↩
Another great look at data. I share you guys with a lot of social media “experts”, on both sides of firearms issues . Maybe some have visited, but both sides have a lot of hard headed members. Keep up the great work.