
Gangs, Guns and the Internet
Did the internet help promote gang lifestyle and migrate it from the city to the suburbs and further into rural areas?
The data says it likely did.
Take-aways
- Two phases of the internet rollout contributed to rising gang-like activity in both rural areas and fringe metro cities.
- It also pushed gang behaviors into suburbs but not to the same degree.
Whispers from the Feds and Detectives
Over the years we’ve heard whispers from police detectives claiming that between YouTube and cell phones, street gang culture had migrated from the inner cities of major metros, all the way out to the suburbs and perhaps beyond.
It certainly seemed that way in 2023, when in the small town of Dadeville, Alabama (population 3,034), there was a mass public shooting with gang-like elements at a Sweet Sixteen party. As in many street gang interactions, gunfire erupted between two groups of people, resulting in innocent folk catching bullets.
But even the federal government noted this trend back in 2012 when the National Gang Center observed it in “suburban counties and smaller cities [where] approximately 40 percent of both experienced the emergence of gang problems in the 1990s.”
The National Gang Center saw it numerically through their interviews of law enforcement agencies across the country. But now in this mature age of internet penetration, we have abundant hard data, and it is confirming the theory… mostly.
Three internet phases and four city clusters
 |
 |
First, our standard note about race: We do not believe that race is a determinant variable in one’s propensity for causing violence.
That said, when it comes to gang-style gun homicides, the largest group to commit and to be killed by such are young black males and largely in major metro areas. The rate of gun homicide for young black males means that it is the most probabilistic model to use to measure the migratory nature of street gang culture and thus street gang-like violence.
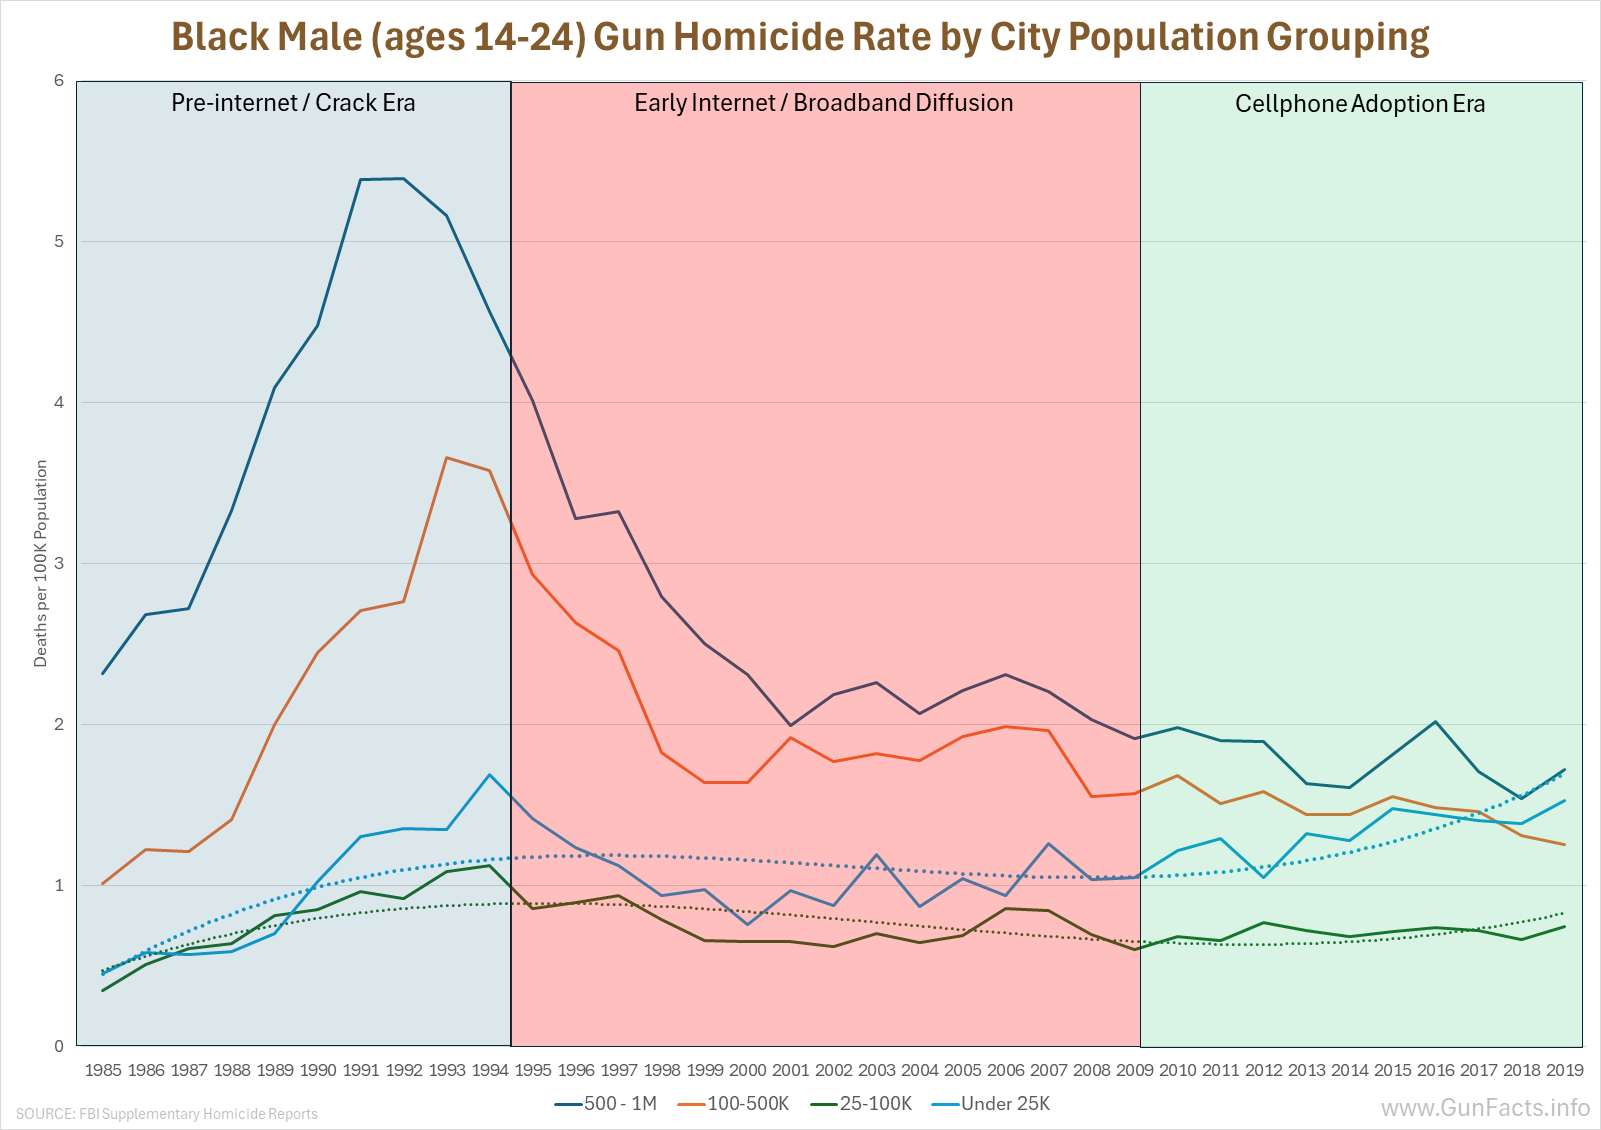
Interestingly, there were several different phases of internet access (one being pre-civilian internet) and they rather neatly fit into this review.
There was the pre-internet era, which happened to coincide with the crack cocaine epidemic in the United States. This gives us a wild baseline to try to follow because it was also the era when violent crime was raging out of control throughout the United States.
This was followed by the early internet adoption phase (think dial-up modems) and then the steady rollout of broadband. That preceded the advent of cell phones and later smartphones so that any intercommunication between street gang members, affiliates, or wannabes was possible all the time. Also, any content, such as gang videos posted on YouTube (which were nearly co-variant with the smartphone era) was universally accessible.
In this chart you can see a definitive upswing starting during phase 2 and well into phase 3 of gun homicides of young black males in small-population cities. After drifting downwards during phase 2, we also see the beginning of a lift in the suburbs in phase 3. So, the effect initially appears to be working, but there are demons in the details.
For this analysis we divided cities in the FBI’s Uniform Crime Reporting System into four major tiers. Going from tier one to tier four, they were:
- The major metro cities where gangs normally operate
- Fringe metro areas, which are the small cities that surround a major city
- The suburbs
- Rural areas
We had a separate look at both the homicide rates for the victims and the rates of gang-related shootings (when that was known) for the perpetrators.
We explored the ratio of the gun homicide rates between the major metro (tier 1) with the fringe metro (tier 2), suburbs (tier 3) and rural cities (tier 4). If the internet was encouraging migration of street gang culture, we would see this ratio get smaller over time. Think of the ratio as a simple comparison. A ratio of 0.50 means the outer area had half the gun homicide rate of major cities. A ratio of 1.0 means they were equal. A ratio above 1.0 means the outer area actually exceeded the major city rate—the trend had not only spread, it had also overtaken its source.
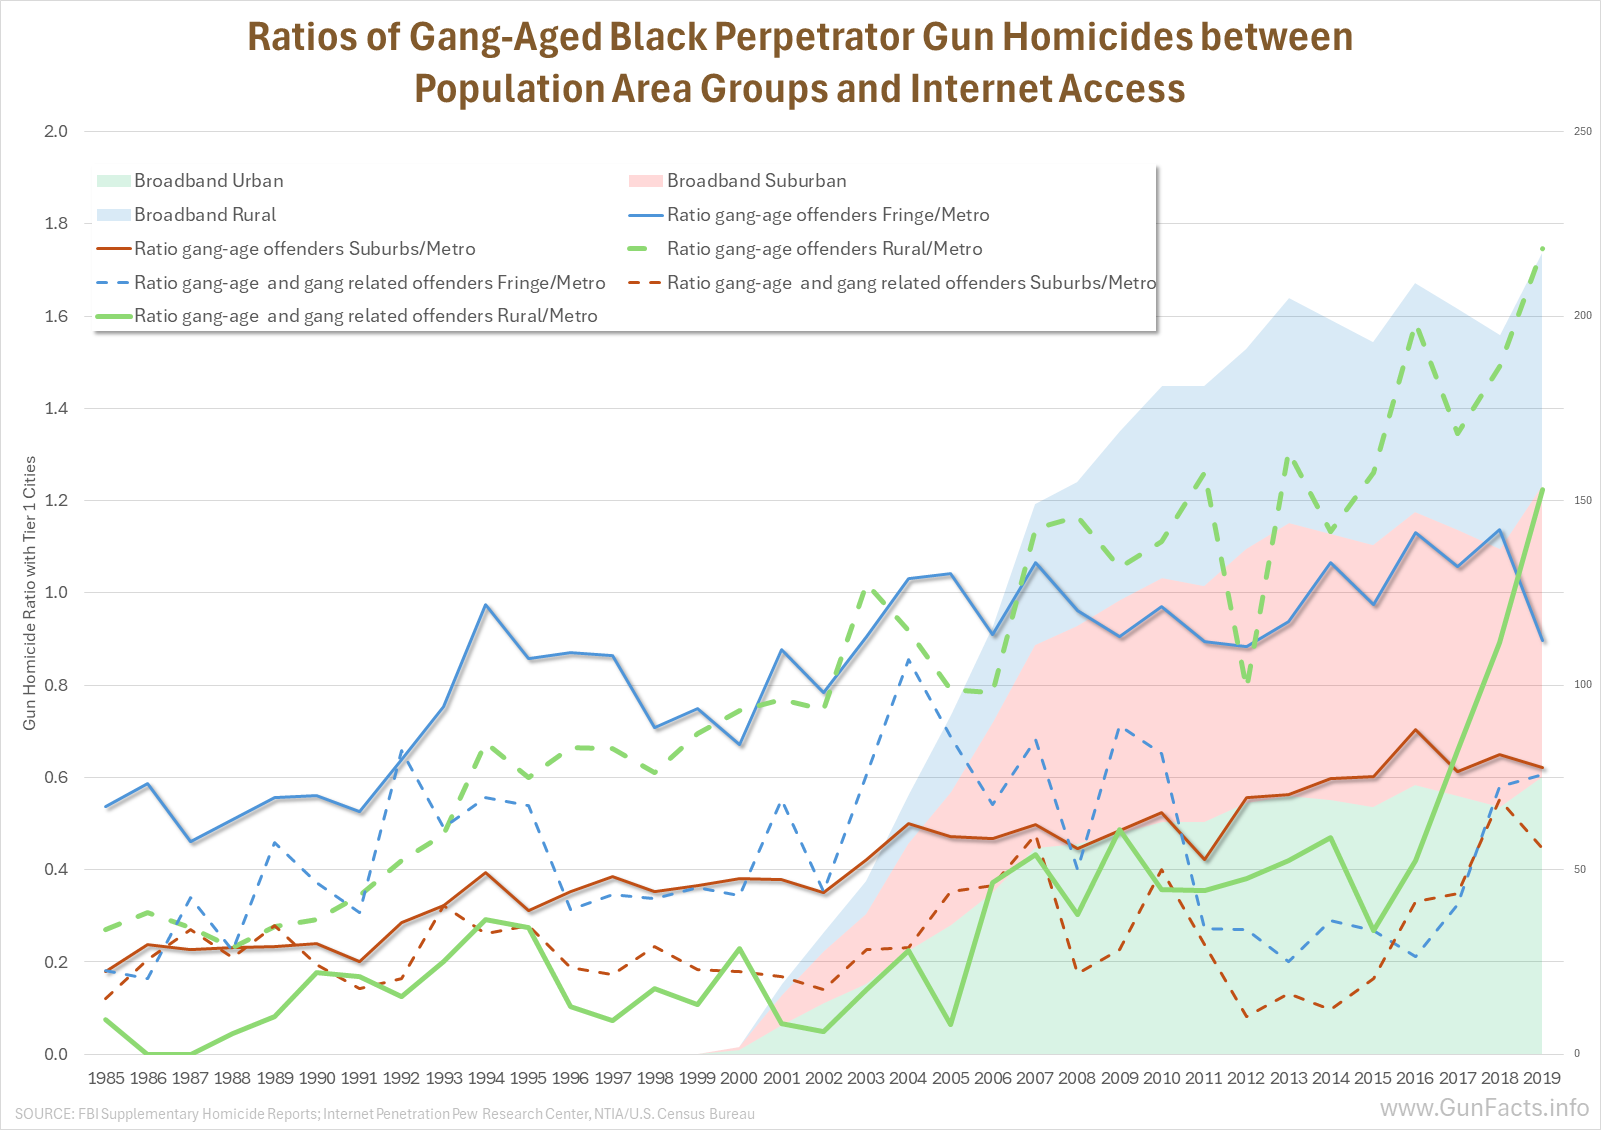 In fact, it occasionally flipped. Some of the smaller tiers developed higher gun homicide rates for young black males than the major metro areas did.
During the second wave, the early internet and broadband era (1995–2008), gun violence in the fringe metro areas not only remained high, but the ratio for offenders between that tier and the primary metro cities crossed the 1.0 point. Simultaneously, the suburbs had a meaningful rise as well. Their gang-related offender ratio climbed from 0.31 in 1995 to 0.50 by 2007, a 60% increase in relative risk. This is the period when suburban broadband penetration went from essentially zero to 55%, and it is what caught the attention of the National Gang Center. Not to be left out, the rural areas began stirring, with victim ratios against the major metro cities climbing from 0.35 in 1995 to 0.55 by 2009. And that was still in the mostly pre-smartphone era.
| RATIO OF TIER RATE TO CORE URBAN (T1) RATE BY YEAR AND PHASE | ||||||
| VICTIM RATES | OFFENDER RATES | |||||
| Year | T2/T1 | T3/T1 | T4/T1 | T2/T1 | T3/T1 | T4/T1 |
| PRE-INTERNET / CRACK ERA (1985-1994) | ||||||
| 1985 | 0.44 | 0.15 | 0.19 | 0.54 | 0.18 | 0.27 |
| 1986 | 0.46 | 0.19 | 0.22 | 0.59 | 0.24 | 0.31 |
| 1987 | 0.44 | 0.24 | 0.21 | 0.46 | 0.23 | 0.28 |
| 1988 | 0.42 | 0.19 | 0.18 | 0.51 | 0.23 | 0.23 |
| 1989 | 0.49 | 0.2 | 0.17 | 0.56 | 0.23 | 0.28 |
| 1990 | 0.55 | 0.19 | 0.23 | 0.56 | 0.24 | 0.29 |
| 1991 | 0.5 | 0.18 | 0.24 | 0.53 | 0.2 | 0.34 |
| 1992 | 0.51 | 0.17 | 0.25 | 0.64 | 0.29 | 0.42 |
| 1993 | 0.71 | 0.21 | 0.26 | 0.75 | 0.32 | 0.48 |
| 1994 | 0.78 | 0.25 | 0.37 | 0.98 | 0.39 | 0.68 |
| Phase avg | 0.53 | 0.2 | 0.24 | 0.61 | 0.26 | 0.36 |
| Phase chg | 0.34 | 0.1 | 0.18 | 0.44 | 0.21 | 0.41 |
| EARLY INTERNET / BROADBAND DIFFUSION (1995-2009) | ||||||
| 1995 | 0.73 | 0.21 | 0.35 | 0.86 | 0.31 | 0.6 |
| 1996 | 0.8 | 0.27 | 0.38 | 0.87 | 0.35 | 0.66 |
| 1997 | 0.74 | 0.28 | 0.34 | 0.86 | 0.38 | 0.66 |
| 1998 | 0.65 | 0.28 | 0.33 | 0.71 | 0.35 | 0.61 |
| 1999 | 0.66 | 0.26 | 0.39 | 0.75 | 0.37 | 0.7 |
| 2000 | 0.71 | 0.28 | 0.33 | 0.67 | 0.38 | 0.75 |
| 2001 | 0.96 | 0.33 | 0.49 | 0.88 | 0.38 | 0.77 |
| 2002 | 0.81 | 0.28 | 0.4 | 0.78 | 0.35 | 0.75 |
| 2003 | 0.8 | 0.31 | 0.53 | 0.91 | 0.42 | 1.02 |
| 2004 | 0.86 | 0.31 | 0.42 | 1.03 | 0.5 | 0.92 |
| 2005 | 0.87 | 0.31 | 0.47 | 1.04 | 0.47 | 0.79 |
| 2006 | 0.86 | 0.37 | 0.41 | 0.91 | 0.47 | 0.79 |
| 2007 | 0.89 | 0.38 | 0.57 | 1.07 | 0.5 | 1.14 |
| 2008 | 0.76 | 0.34 | 0.51 | 0.96 | 0.45 | 1.17 |
| 2009 | 0.82 | 0.32 | 0.55 | 0.9 | 0.48 | 1.06 |
| Phase avg | 0.80 | 0.30 | 0.43 | 0.88 | 0.41 | 0.84 |
| Phase chg | 0.09 | 0.11 | 0.18 | 0.04 | 0.17 | 0.46 |
| CELLPHONE ND SOCIAL MEDIA ADOPTION ERA (2010-2019) | ||||||
| 2010 | 0.85 | 0.34 | 0.61 | 0.97 | 0.52 | 1.11 |
| 2011 | 0.79 | 0.35 | 0.68 | 0.89 | 0.42 | 1.26 |
| 2012 | 0.84 | 0.41 | 0.55 | 0.88 | 0.56 | 0.79 |
| 2013 | 0.88 | 0.44 | 0.81 | 0.94 | 0.56 | 1.31 |
| 2014 | 0.9 | 0.42 | 0.8 | 1.07 | 0.6 | 1.13 |
| 2015 | 0.85 | 0.39 | 0.82 | 0.98 | 0.6 | 1.26 |
| 2016 | 0.73 | 0.37 | 0.71 | 1.13 | 0.7 | 1.59 |
| 2017 | 0.85 | 0.42 | 0.82 | 1.06 | 0.61 | 1.35 |
| 2018 | 0.85 | 0.43 | 0.9 | 1.14 | 0.65 | 1.49 |
| 2019 | 0.73 | 0.43 | 0.89 | 0.9 | 0.62 | 1.75 |
| Phase avg | 0.83 | 0.4 | 0.76 | 0.99 | 0.58 | 1.3 |
| Phase chg | -0.12 | 0.09 | 0.28 | -0.07 | 0.1 | 0.73 |
| NOTES T1 = Core Urban T2 = Secondary Urban T3 = Small City T4 = Small Town Source: FBI Supplementary Homicide Reports via UCR/ICPSR 1985-2019 |
||||||
It is in the third wave, when smartphone and social media access grew and became universal, that we see the most interesting and disturbing change. For rural areas, the gun homicide rate, in regard to offenders that fit the profile, surged, crossing the 1.0 threshold. In other words, gang-age black males in rural areas were now competing with gang-age black males in urban areas in terms of gun homicides. Suburbs as well were climbing during this period, though not as aggressively.
Distilling all this a bit, for small cities and suburbs, the broadband era was the pivotal moment, not the smartphone era. The offender ratio roughly doubled between 1995 and 2007—from 0.31 to 0.50—and then continued rising more slowly through the smartphone era to 0.62 by 2019. One key aspect is that the rate of change was faster in the broadband period than in the smartphone period for this tier. This makes geographic sense: suburbs got wired earlier during broadband rollout while small towns were still largely offline, so the effect of broadband was greatest in suburbs first.
Culture is mobile
Human culture has always been mobile. Look at the cultural exchange between ancient Greece and ancient Rome. They positively copied each other’s religions, art, food, drink, and even their libertine excesses.
And they didn’t have the internet.
Street gangs have their own microcultures and they aren’t ashamed of promoting those cultures, be it through music or through videos posted on YouTube. They define the social mores of their culture.
But before the internet, you’d actually have to be able to see and smell a gang member to be infected by his gang’s culture. Now a teenager in Turkey Scratch, Arkansas, can get direct cultural input from Chicago’s Gangster Disciples.
The hard data indicates that the internet very likely did help the spread of gang culture out into surrounding cities, off into the suburbs and even to rural areas. We can’t put that genie back in the bottle, can we? The internet is way too valuable a tool for non-gang members, but we have to accept the fact that as long as it exists and as long as the major urban centers of America fail to hamstring street gangs, gangs will continue to remotely affect and infect young males throughout the country.
Comments
Gangs, Guns and the Internet — No Comments
HTML tags allowed in your comment: <a href="" title=""> <abbr title=""> <acronym title=""> <b> <blockquote cite=""> <cite> <code> <del datetime=""> <em> <i> <q cite=""> <s> <strike> <strong>