
Two Phase Crime Control
Getting tough on criminals works in terms of reducing violence.
We saw two waves of such in the late 20th century, and their combined stories tell us many interesting things, including why some of the numbers look a little odd.
Take-aways
- Two waves of tough-on-crime laws suppressed gun violence but in different ways.
- The first wave made reductions via the second wave look less effective than they otherwise would have appeared.
- Federal initiatives to get all states to enact certain tough-on-crime laws helped more crime-lenient states catch up to more restrictive states in terms of reducing violent crime.
The issue and the reaction
Violent crime in America started a steady and steep upward climb in the 1970s and 1980s and into the first few years of the 1990s.
And Americans got damn sick of it all.
In response to seemingly out-of-control crime, states and even the federal government began looking at the data and noticed a few disturbing facts.
- Habitual criminals committed a disproportionately large share of crimes.
- Judges were not sending criminals to jail for the amount of time that laws required.
- Teenagers who committed heinous crimes, such as murder, were often released into the wild, once they turned eighteen, and resumed committing heinous crimes.
- The criminal use of guns tended to go hand in hand with other violent crimes
In response/reaction to these realities, states began passing a variety of “tough on crime” laws. This included everything from “truth in sentencing” laws that forced judges to follow legislated sentencing guidelines, mandatory minimum sentences, and extended sentences for using guns in the commission of crimes.
This had an effect but not enough of one for the general public’s taste.
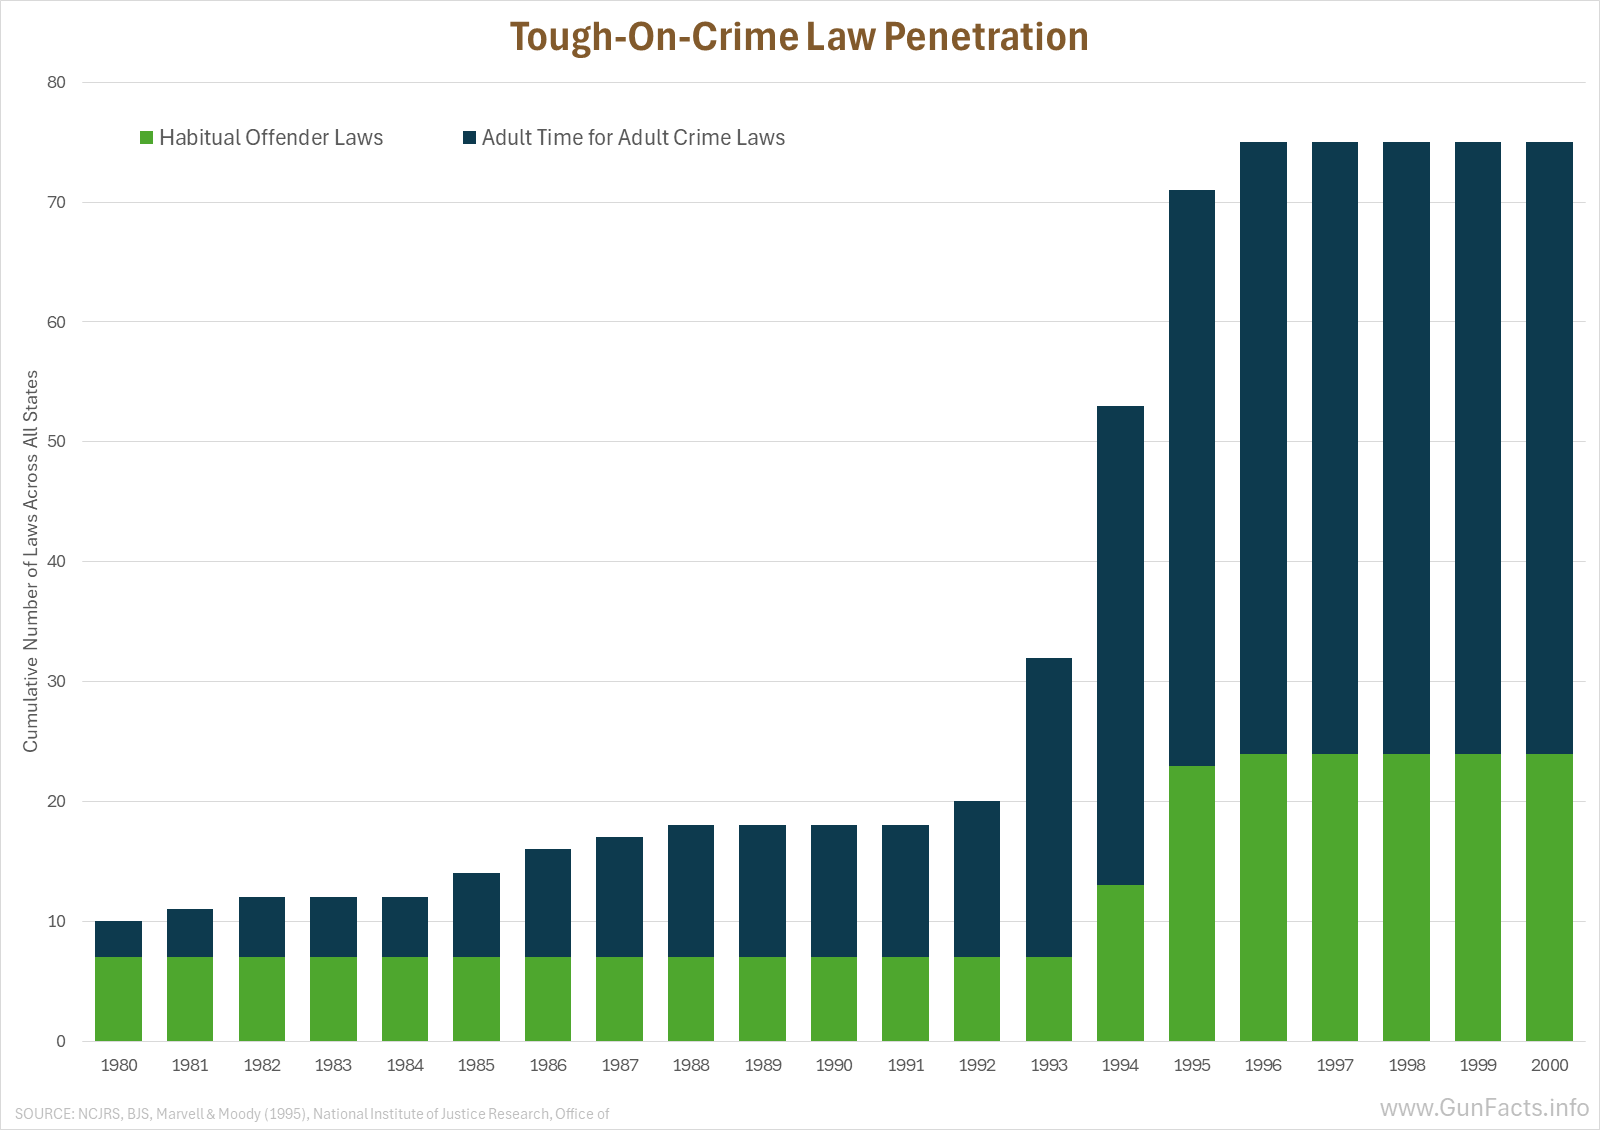
Despite the longer sentences, the issue of habitual criminals and teenage thuggery continued to be a statistical reality. Hence, in 1993 citizens dropped some tough-on-crime nukes. They aggressively passed habitual offender laws and started treating juvenile gangsters as adults.
But this trend was not universal across all states; and mostly the states that did pass those post-1992 criminality nukes were the same states that had passed previous tough-on-crime laws.
The question then is how much of an impact did the pre- and post-1992 legislative response to violent crime actually reduce violent crime, particularly gun homicides?
The pre-1992 ramp up
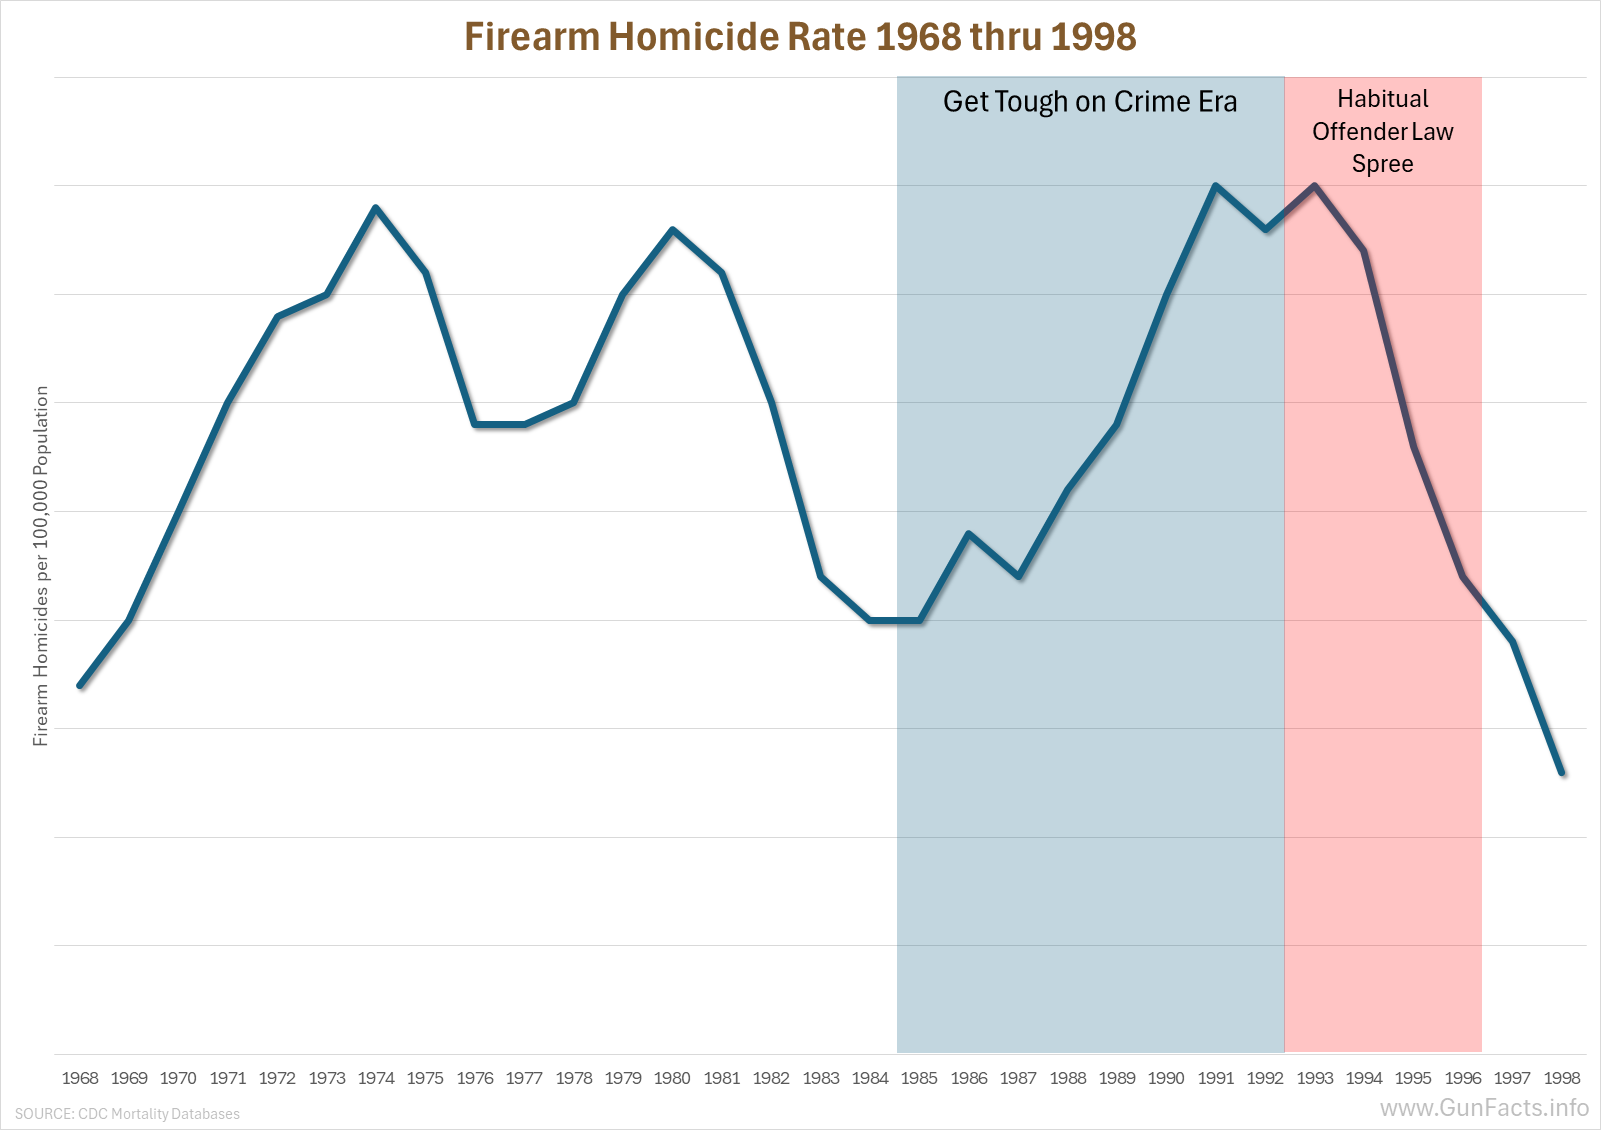 For years, we have noted the rapid decline in firearm homicide rates that occurred during the era of passing habitual offender laws starting in 1993.
But that did not explain why the firearm homicide rate started to level off before 1993.
States had started enacting get-tough-on-crime laws as violent crime began to surge in the late 1980s. Among the laws rapidly being enacted in the 1980s to fight violent crime were:
- Mandatory Minimum Sentencing
- Determinate Sentencing / Sentencing Guidelines
- Parole Abolition or Severe Restriction For Violent Crimes
- Firearm Sentencing Enhancement For Other Crimes
- Truth in Sentencing (imposing legislated sentences in court and parole)
After grinding some numbers 1 we concluded two different, yet complementary things.
- States that enacted mandatory minimum sentencing laws averaged 0.663 fewer gun homicides per 100,000 people compared to states that did not (after controlling for state and year differences). That is significant when you consider that the average firearm homicide rate in those states was 4.89 in 1985, which translates to a 13% reduction.
- Adding more tough-on-crime laws after that increases the effectiveness but at a diminishing rate of returns. For example, once states added truth-in-sentencing and sentencing guidelines, the additional reduction is only another 0.34 gun homicides for a 100,000 population.
A strong case can be made that “get tough on crime” laws caused a rapidly rising gun homicide rate to level off even before three-strike laws were enacted. Do understand, it takes a little time for minimum sentencing laws, truth-in-sentencing laws, and other get-tough-on-crime laws to peel enough violent criminals off the street for the effect to show. But it did show, and this possibly created some confusion when the next phase of get-tough-on-crime laws started.
The post-1992 phase
The unanswerable question is, if the preexisting get-tough-on-crime laws had been left in place with no additions, would a decline in gun homicide rates as well as other violent crimes have started on their own?
We’ll never know, because starting in 1993 people in America had had more than enough of rising violence rates. Within four short years 24 states, with more than half of the country’s population, passed habitual offender laws and started to treat teenage violent criminals as adults, removing youthful parole and perhaps keeping them from escalating and amplifying their modes of violence.
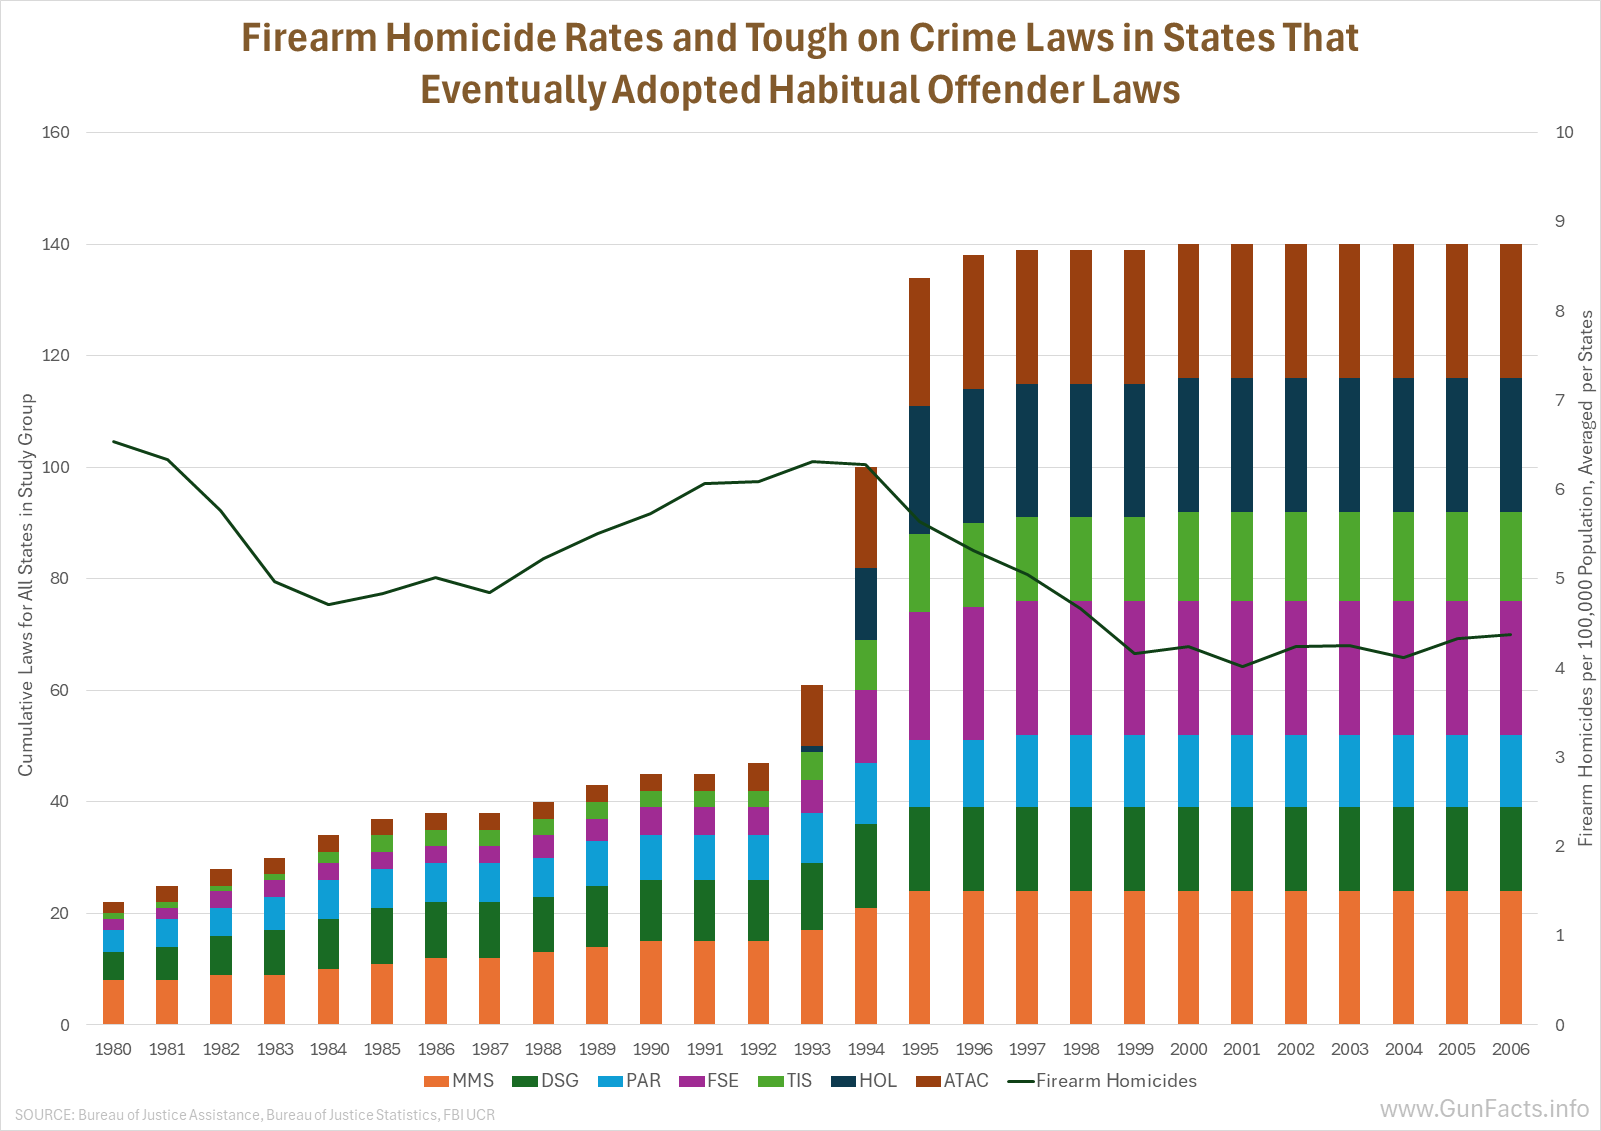
States that entered 1993 with more preexisting tough-on-crime laws had significantly lower gun homicide rates throughout the study window. That’s a testament itself but it causes confusion because the rate of decline due of habitual offender laws (aka three-strike laws) would be muted compared to other states that did not enact similar habitual offender laws. They had less room to fall.
 Regardless of that differential, habitual offender laws did have a statistically measurable impact. The situation is clouded by the fact that every state that enacted habitual offender laws had already, or enacted at the same time as habitual offender laws, Adult Time for Adult Crime (ATAC).
Which gets to a juicy bit of speculation. ATAC laws were so broadly enacted (all 50 states), and so quickly, that the effects are inseparable from the national crime decline—which is not necessarily proof of cause and effect. But it is impossibly hard to ignore.
Then we get to 1994 and when the federal government caused even the laggards to start incarcerating more violent people.
The Violent Crime Control and Law Enforcement Act 2 of 1994 was, at that point, the largest federal crime legislation enacted in US history. Congress bribed the states with over $30 billion to do a number of things including abiding by the terms of the Violent Offender Incarceration and Truth-in-Sentencing Incentive Grants Program. Consequently, the majority of states (30) adopted Truth in Sentencing laws that put violent offenders in the pokey for at least 85 percent of their sentences. It also put $30 billion into state and local law enforcement agency budgets to hire community policing officers, increasing police presence.
It worked. Eight states had truth-in-sentencing laws before the 1994 federal legislation, and by the turn of the century it was 30.
But like the entire get-tough-on-crime spree, we saw other jumps in this era. Passing habitual offender law were 24 more states that add to the previous seven. And all 50 states enacted minimum mandatory sentences, firearm sentencing enhancements, and juveniles-as-adults laws.
Let’s not dismiss the habitual offender laws just yet. States that enacted HOL laws showed average homicides and non-negligent manslaughter sentences that were 2.25 years longer after enactment. Less than two and a half years may not sound like a lot, but that’s for all homicides and manslaughters, and not just those that triggered a second or third strike penalty. And keep in mind that states that had past habitual offender laws had, by and large, already enacted other get-tough-on-crime laws, such as truth-in-sentencing. The incremental added value of habitual offender laws was less than it would have been if it had been the only corrective measure.
But that’s also the average of all states that did pass habitual offender laws. The application in those states was not consistent. Among the heavy hitters were Washington State, which saw increased average sentences of 3.89 years (30.6%), Pennsylvania 4.01 (21.7%), Nevada 4.39 (17.9%), Arkansas 3.60 (19.7%), and Tennessee 2.72 (14.7%). But eight states showed decreases, with Virginia (−6.38 years, −27.8%) and North Carolina (−3.36, −16.0%) dragging the average back down substantially.
What does this all mean?
 |
 |
 |
Let’s stitch some of this together.
Before 1993 among the get-tough-on-crime laws, mandatory minimum sentencing had a significant effect on firearm homicide rates, reducing those rates by over 0.6 people per 100,000.
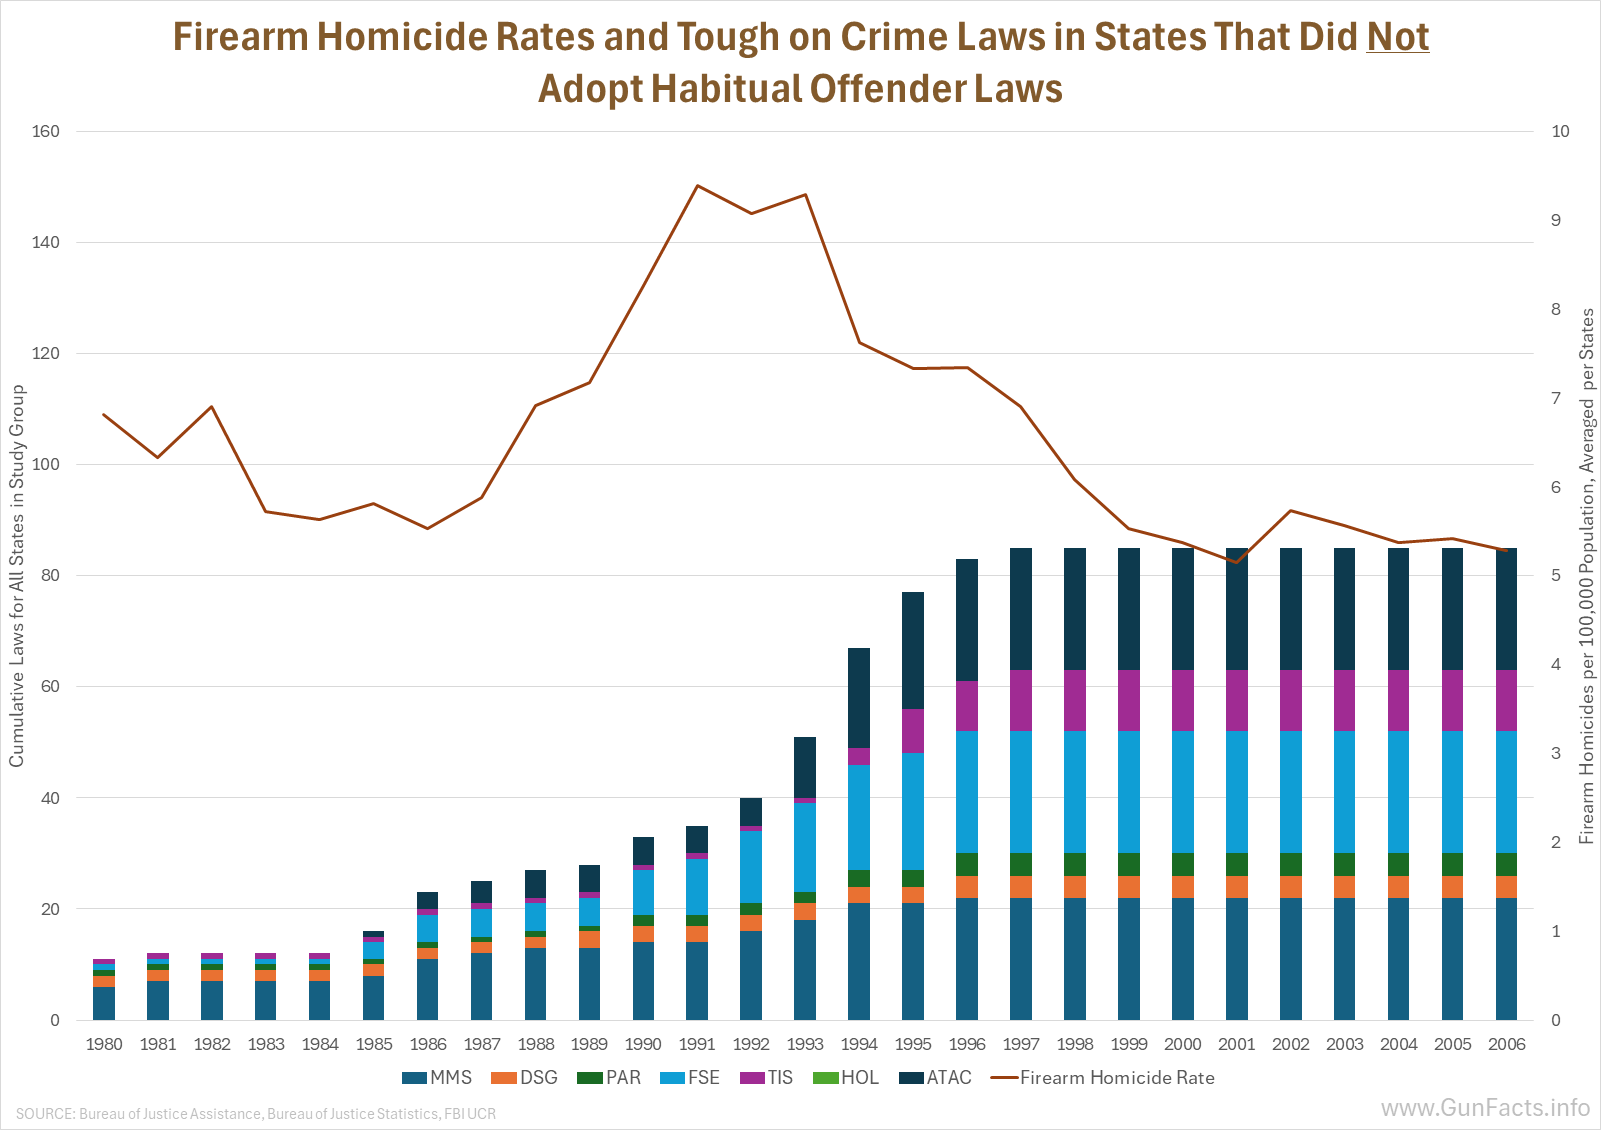
After 1993, expanding truth-in-sentencing laws had a statistically significant effect for all the states that did not previously pass much in the way of get-tough-on-crime laws.
Right off the bat we see that expansion having a definitive and significant effect on sentences for violent crimes and making sure that those sentences were served effectively.
But after 1993 we also saw a huge jump in the number of states treating juvenile violent criminals like adults, culminating in all states doing so by 1996. Habitual offender laws didn’t apply to juveniles before then, but they did now. Some jurisdictions went even further, counting juvenile adjudications as strikes if the offense would have constituted a felony had it been committed by an adult (California courts determined that juvenile convictions can count as strike offenses under Proposition 184).
But the results would have been better …
A funny thing happened on the way to prison…
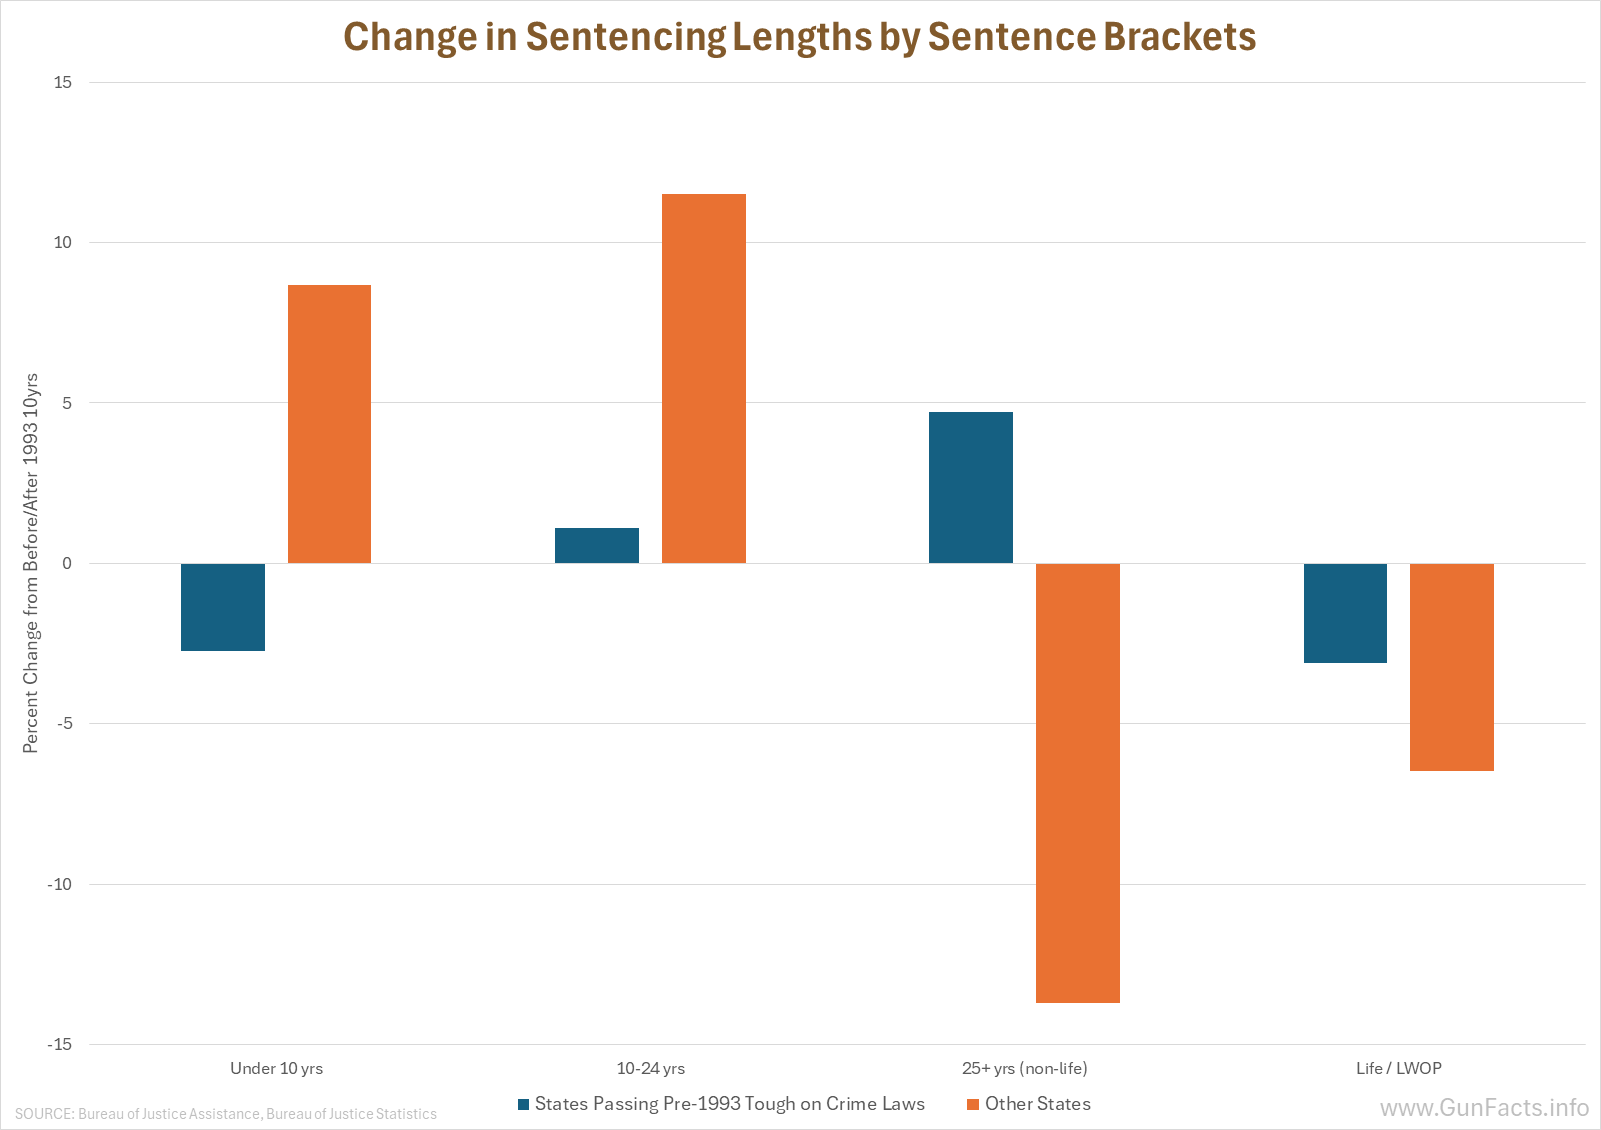
When the nation greatly expanded truth-in-sentencing laws along with habitual offender laws. In a lot of places, the length of these sentences became shorter, not longer.
On the surface it looks like a hell of a paradox. But it can be explained by judges and prosecutors and perhaps a lack of funding in states for their legal systems.
Before truth-in-sentencing in habitual offender laws, judges would often sentence violent criminals to the maximum extent of the law, knowing that parole boards would radically shorten the sentence. For example they would put somebody away for 25 years, knowing that the parole board would release them after eight.
After truth-in-sentencing and habitual offender laws became predominant, judges stopped issuing lengthy sentences, knowing that convicts would serve at least 85% of their sentence under truth-in-sentencing laws or would be receiving the same treatment via habitual offender laws. (Under normal circumstances, inmates can reduce their sentences by earning credits for good behavior and program participation. Habitual offender statutes frequently carve out an exception, ensuring that a person sentenced as a repeat offender serves at or close to the full minimum term. But this is inconsistent from state to state.)
Right or wrong, prosecutors have broad discretion in charging decisions, including charging people under habitual offender laws. A prosecutor can decline to file a second or third strike charge even when the defendant has qualifying prior convictions. Prosecutors might do this because they believe the mandatory sentence is disproportionate to the current offense, because they want to use the strike threat as leverage in plea negotiations, or simply because their office has an informal policy against applying the law to certain offense types.
In short, prosecutors often decide who will go to prison for a long period of time, regardless of the will of the voters.
It gets even a little stranger. Though many states initially stripped judges of any discretion under habitual offender laws, the courts pushed back. For example, a case in California (People v. Romero) ended up with the California Supreme Court declaring that trial courts have discretion to dismiss or strike prior strike allegations in Three Strikes cases, either on the court’s own motion or on motion of the prosecutor (even over the prosecutor’s objection).
Stated more bluntly, trial judges can creatively thumb their noses at three-strike law requirements.
That’s providing that it goes that far. Many offenses that qualify as second or third strikes can be charged as either felonies or misdemeanors at the prosecutor’s discretion (“wobblers”). A prosecutor who wants to avoid a mandatory strike sentence on a sympathetic defendant can simply charge the qualifying offense as a misdemeanor, which removes it from strike eligibility entirely. If done routinely a repeat felonious offender might never come under the edicts of a habitual offender law.
The California Conundrum
California entered 1980 with four tough-on-crime laws already in place — mandatory minimum sentences, determinate sentencing / sentencing guidelines, parole abolition or severe restriction, and adult time for adult crime — all enacted in 1976–1977, years before anyone else. By the start of the 1993-1996 habitual offender law spree, California had already done more than any other state to get tough on crime.
But unlike other proactive states, their gun homicide rate skyrocketed.
Despite having more pre-existing laws than almost any state in the country, California’s gun homicide rate was rising throughout the first phase — from 6.7 in 1982 all the way up to 9.8 in 1992. Every other proactive state was declining or flat.
And since they made up 23% of the population of all of the proactive states, this artificially depressed the effectiveness of that group of states in terms of lowering gun homicide rates.
But they bounced back starting in 1994. First, they passed their habitual offender law, a three strikes variant. Next, they enacted a series of parole tightening measures, dramatically expanded use of parole revocations for technical violations, and strengthened the 10-20-Life firearm enhancement (10 years for using a firearm in a crime even if not discharged, 20 years for discharging the firearm, 25 to life if the bullet hits somebody).
The cumulative effect was staggering. California’s prison population jumped 30% in five years after the 1994 Three Strikes law, growing by almost net 50,000 inmates (39%) when it peaked in 2007. According to the Assembly Analyst Office report on the first decade of the three strikes law, over 80,000 people had been processed for second- or third-strike charges.
So just in case you haven’t been creating your own scorecard, here’s the basic chronological process with its various mishaps and outcomes:
- A variety of tough-on-crime laws were started in the 1980s and they effectively suppressed a national rise in gun homicides.
- Because of this, states that had added these tough-on-crime laws and later added habitual offender laws started with lower gun homicide rates and had less distance for those crime rates to fall.
- In the 1990s many states passed habitual offender laws and, thanks to federal government funding, a bunch of states also passed truth-in-sentencing laws (as well as treating juvenile violent perpetrators as adults).
- But as for habitual offender laws, they were mainly enacted by states who had already gotten tough on crime.
- Sentencing lengths were artificially high before 1993, especially in states that had not passed tough-on-crime laws, because judges wanted to extend sentences to compensate for early parole.
- Once truth-in-sentencing laws were more widespread, prosecutors in habitual offender law states often plea bargained or reduced charges in order to avoid lengthy and costly trials, which in turn shifted sentencing lengths down into lower brackets.
And thus, sentencing lengths did not radically go up. Total time served did not radically go up either; but the worst of the worst did get the toughest sentences, and that helped.
The Summary:
America doesn’t like violent crime and starting in the late 1980s they did something about it.
It occurred in two waves, pre- and post-1993. The laws passed leading up to 1993 had an effect, and so did the laws passed after 1993, but for different reasons.
Among the get-tough-on-crime laws passed in either of those phases, we see these solution sets:
- Have a significantly long sentence for violent crime.
- Make inmates serve their entire sentence.
- Make repeat offenders serve longer sentences.
- Make juvenile violent crime subject to adult charges.
And we also saw that states who started taking action in the 1980s put a lid on the growing violent crime epidemic; whereas states that did not suffered greatly, with soaring firearm homicide rates, until they too realized that prisons exist for a reason and started putting the reasons behind bars.
Methodologies
Pre-1993 estimates were produced using two-way fixed effects OLS regression with state and year fixed effects and state-clustered standard errors, applied to an unbalanced panel of 46 states across 1980–1992. Treatment variables represent cumulative law adoption indicators for seven tough-on-crime policy categories, tested both individually and as theory-driven subsets.
Data sources
OUTCOME VARIABLE:
CDC WONDER, National Center for Health Statistics (NCHS). Compressed Mortality File.
National Center for Health Statistics. Vital Statistics of the United States, annual volumes. National firearm homicide rates 1960–1980. U.S. Department of Health and Human Services.
INCARCERATION DATA:
Bureau of Justice Statistics. National Corrections Reporting Program (NCRP), 1991–2017. ICPSR Study Numbers 37951 and 39234. Individual-level records of prison admissions, releases, offense type, and sentence length used to measure incarceration rates and actual time served for violent crimes.
CONFOUNDING VARIABLES:
U.S. Bureau of Labor Statistics. Local Area Unemployment Statistics (LAUS). State-level annual unemployment rates, 1991–2006.
U.S. Census Bureau. Small Area Income and Poverty Estimates (SAIPE) Program. State-level poverty rates, 1991–2006.
KIDS COUNT Data Center. Nonmarital birth rates by state and year, 1991–2006. datacenter.kidscount.org.
Integrated Public Use Microdata Series, Current Population Survey: Version 11.0 [dataset]. Minneapolis, MN: IPUMS, 2023.
Used to construct: (1) gang-age population share (ages 15–29) and (2) percent of adults ages 20–25 without a high school diploma, 1991–2006.
FBI Uniform Crime Reports. Law Enforcement Officers Killed and Assaulted / Police Employee Data. Police Officers per 1,000 population by agency and population group, 1991–2006.
SENTENCING LAW ADOPTION DATA:
Bureau of Justice Assistance. 1996 National Survey of State Sentencing Structures. NCJ 169270. Washington, DC: U.S. Department of Justice, Office of Justice Programs, September 1998.
Ditton, Paula M. and Wilson, Doris James. Truth in Sentencing in State Prisons. Bureau of Justice Statistics Special Report. NCJ 170032.
Clark, John, Austin, James, and Henry, D. Alan. “Three Strikes and You’re Out”: A Review of State Legislation. National Institute of Justice Research in Brief. NCJ 165369. Washington, DC: U.S. Department of Justice, National Institute of Justice, September 1997.
Marvell, Thomas B. and Moody, Carlisle E. The Impact of Enhanced Prison Terms for Felonies Committed with Guns. Criminology, 33(2), 247–281, 1995. Used for state-level firearm sentencing enhancement enactment years.
Bureau of Justice Statistics. Trends in State Parole, 1990–2000. NCJ 184735. Washington, DC: U.S. Department of Justice, Office of Justice Programs, October 2001.
Snyder, Howard N. and Sickmund, Melissa. Juvenile Offenders and Victims: 1999 National Report. NCJ 178257. Washington, DC: U.S. Department of Justice, Office of Justice Programs, Office of Juvenile Justice and Delinquency Prevention, 1999.
Redding, Richard E. Juvenile Transfer Laws: An Effective Deterrent to Delinquency? OJJDP Juvenile Justice Bulletin. NCJ 220595. Washington, DC: U.S. Department of Justice, Office of Justice Programs, Office of Juvenile Justice and Delinquency Prevention, August 2010.
Morelli, M., Edelman, P., and Willoughby, S. Survey of Mandatory Sentencing in the U.S. NCJ 80919. Washington, DC: National Criminal Justice Reference Service, 1981.
FEDERAL LEGISLATION REFERENCE:
Violent Crime Control and Law Enforcement Act of 1994. Public Law 103-322, 108 Stat. 1796. 103rd Congress. Signed September 13, 1994.
U.S. Government Accountability Office. Truth in Sentencing: Availability of Federal Grants Influenced Laws in Some States. GAO/GGD-98-42. Washington, DC: U.S. Government Accountability Office, February 4, 1998. Confirms that financial incentives in the 1994 Act directly influenced state TIS adoption decisions.
Bureau of Justice Assistance. Violent Offender Incarceration and Truth-in-Sentencing Incentive Formula Grant Program: Report to Congress. Washington, DC: U.S. Department of Justice, Office of Justice Programs, Bureau of Justice Assistance, February 2012.
Notes:
- To test whether tough-on-crime laws passed in the 1980s were associated with lower gun homicide rates, we compared states that had adopted these laws against states that had not, year by year from 1980 through 1992, while controlling for preexisting differences between states and national trends affecting all states simultaneously. ↩
- Key provisions used in this analysis: Title II (Violent Offender Incarceration and Truth-in-Sentencing Incentive Grants, §§20101–20109) and Title I (Public Safety and Policing, §§10001–10003, establishing the COPS program). ↩
Comments
Two Phase Crime Control — No Comments
HTML tags allowed in your comment: <a href="" title=""> <abbr title=""> <acronym title=""> <b> <blockquote cite=""> <cite> <code> <del datetime=""> <em> <i> <q cite=""> <s> <strike> <strong>