
Missouri Compromised
If your doctor is a member of the American Medical Association, get another doctor. QUICKLY!
A new low in gun research by doctors may have been reached in a recent article in the Journal of the American Medical Association (JAMA). 1 This now disreputable rag is allegedly “peer reviewed,” but that claim is credible only if the peers are refugees from the local sanitarium.
In their fresh assault on logic, the sundry docs and quacks concluded that changes in pistol purchase and concealed carry laws in Missouri (MO) caused suicides in younger people to rise. They did this by creating synthetic models that invented suicide statistics by incorporating erratic source data. They had to take this approach because the real numbers were not exactly in their favor.
The Big Scary … Not
JAMA launched into their artless misdirection by saying “suicide was the second leading cause of death for children and young adults aged 10 to 24 years” in MO. The astute reader (that would be you) has already noticed that the age range here goes from kids to adults who recently graduated with worthless college degrees and a mountain of student loans, which alone would raise the suicide rate of the 22–24 year olds.
| Age | Homicide | Suicide | Uninten-tional | Non-Injury, no intent classified |
| 1–4 years | 12.6 | 15.6 | ||
| 10–14 years | 6.7 | 12.8 | ||
| 15–19 years | 12.7 | 16 | 29 | 13 |
| 20–24 years | 24.6 | 25.8 | 56.7 | 18.1 |
Indeed, we see the first data glitch in that Missourians aged 10–14 have no suicides, according to a data dump from the Centers for Disease Control (CDC) from the same year that JAMA generated their claim. Even for the top age bracket, the gap between homicides and suicides was fractional, and accidental deaths were more than double the suicide rate. So not only was the game rigged by including age groups that traditionally have low suicide rates (ages 10–19), they didn’t even get the bottom-line numbers right.
Let’s hope they do better with your prescription dosage.
The Ugly Claim Is a Shame
 Which gets us to the core issue. Suicides, especially among the young, are pretty rare. They are so rare, in fact, that the CDC flagged 81% of all data rows for suicides in Missouri as “unreliable,” which is their parlance for “the raw numbers are sooooooo low that our statistics enter the realm fragility.”
Real researchers—which evidently does not include those publishing in JAMA—would have known or noticed this right off and thus questioned in advance any conclusions that could be made about straightforward calculations, not to mention exotic modeling to create suicide statistics out of something thinner than air.
To give you an idea of how rare this is, in the age groups that JAMA evaluated, there were 182 suicides for all of 2017, and firearm suicides were a subset of that (116). Each suicide is a tragedy, so we are thankful the suicide count is that low.
Quasi Quackery
“The synthetic Missouri provided an estimate of expected firearm suicide rates in Missouri if the laws had not changed.”
Lifted from the JAMA paper itself, the phrase “synthetic Missouri” sounds like the title of a bad Southern fried crystal meth movie. And perhaps the researchers were doing some psychotropic pharmaceutical research on themselves when they decided that synthetic modeling was a valid approach to investigating suicide rates and concealed carry of weapons (CCW).
For the uninitiated, synthetic modeling seeks to create data by defining a model of the assumed reality. This is a valid approach for some research, such as when source data is scarce, but the CDC has all the data, so it appears that another agenda was at play. What the researchers invented were suicide statistics that they assumed would have occurred if Missouri had not changed either or both of the pistol purchase permit (PPP) or CCW laws.
As with all models, the assumptions and source data control the intellectual viability of the outcome, which in this paper’s case is zilch.
CCWs are the most laughable of the cases. On this point, the researchers compare Missouri with 42 states whose CCW laws did not change during the study period (2008 through 2018). Sounds good until you notice that the 42 states were not those that were all “shall issue” states like Missouri was throughout most of this study’s period, but a morbid mash of everything from Alabama (155,000 CCWs per 1M residents) to New Jersey (136/1M). In this mix were total “shall issue” states (e.g., Florida) to states with many hoops to jump through (North Carolina) to “may issue” states where nobody except the rich and well-connected can get a permit (New York). Thus, the not-so-good-doctors were comparing Missouri to a Frankenstein monster of mismatched parts and trying to draw rational conclusions from it.
 But what do the raw numbers say?
Not much.
There was a steady rise in non-firearm suicide rates in Big MO. But aside from a transient two-year spike, firearm suicides remained more or less flat. Indeed, in 2014, after both laws had changed, firearm suicides hit a nadir.
Take Two and Don’t Call Anyone
With the AMA, always get a second opinion.
Also, print out this post and take it with you to your next doctor’s appointment. Ask your sawbones if he or she is an AMA member, and if they are, stuff this blog into their pocket before asking for referral to a new and better healer.
Notes:
- Association of Changes in Missouri Firearm Laws With Adolescent and Young Adult Suicides by Firearms, Bhatt, Cheng, Morris, Beyer, Chestnut, Steigerwalt, Metzner, 2020 ↩
There are Lies – Damned Lies – and Statistics
I think Mark Twain that.
If you can juggle numbers, you can “prove” anything …. even using the exact same data set.
Hi, do you have a direct link for the massacre data table in this piece?
http://www.gunfacts.info/blog/auditing-australia/
What do you think of this study? Maybe you can critique it in your research analysis page?
https://onlinelibrary.wiley.com/doi/10.1111/1745-9133.12485
The Australian crime data comes from the Australian Institute of Criminology. You can find all that data and more on their website.
We have not (yet) reviewed the “Assessing the potential …” paper. Likely won’t since it is a review of literature and we would have to read each paper the main paper refers to. But we have tackled the “magazine capacity and mass public shooting” topic ourselves … see http://www.gunfacts.info/blog/magazine-capacity-muckraking/
Ok, so do you think you could go over each palate it references and see what critique you can make of it?
Sorry, I don’t see that getting onto our work load any time soon (we are seriously backlogged).
If you’d oblige email me or I could email you, I’d love to help debunk myths about gun control any way I can
Also according to your magazine capacity analysis how much higher are the deaths in percent from high capacity to low capacity? Also what about woundings?
We’d have to pry open the spreadsheet, and I’ll see if I can get to that soon.
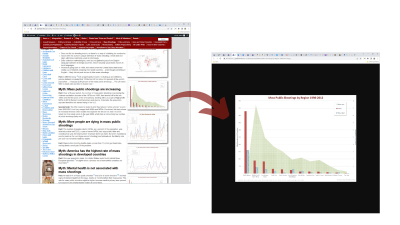
But for now, this chart (in the article) shows a big problem in doing such an analysis. The “cattlepen scenario” is the main driver of the body count. If you do not include the carefully planned cattlepen events (at least the five events on the right of the chart), the increased body count in events using higher capacity magazine is marginal at best.
http://www.gunfacts.info/wp-content/uploads/2019/02/Deaths-in-Mass-Public-Shootings-by-Magazine-Capacity-1998-2018.png
Yes I think that is very true. However my question is controlling for variables such as cattle pen and other ouliters, how much higher are mass shootings with high capacity magazine over low capacity magazine? In terms of percentage using the 1098-2018 data set. This of course doesn’t automatically prove that that per range is attributable to magazine size but I’d just like to know
Here is a quick-n-dirty summary of the average number of people killed and wounded in mass public shootings that were not either (a) well planned events or cattle pen scenario events:
Killed Woulded
<10 Rounds 6.6 4.7
10-14 Rounds 6.0 2.5
>= 15 rounds 6.8 5.2
Statistically, no real difference. As we noted in the report we supplied before, the body count is primarily dependent on the number of victims and their inability to escape or find cover.
How do you find the mass homicide statistics? I went to the Institutes webpage and searched “Mass Homicide” I only got a paper that covered 1989-1999. Can you help please?
You have to grab the raw data and filter for the agreed upon definition for mass public shooting (or, extending as appropriate to non-firearm mass murder, the same criteria).
“ Killed Woulded
= 15 rounds 6.8 5.2”
2 questions
What period of time does this summary cover?
What defines a “well planned event”?
All research volunteers sign up at:
http://www.gunfacts.info/alerts-and-volunteers/
The years are from the Gun Facts Mass Public Shooter database (see https://www.gunfacts.info/research-resources/mass-public-shooting-database/). We used an updated, but not yet published version that covers American MPSs from 1982 through present.
Well planned events were defined via the Violence Project MPS database. IIRC, “well-planned” means that the perpetrator thought through the venue, weapons, and methodology of the attack (e.g., it was not spontaneous).
So using the new data on high capacity magazines I guess gun control advocates should now want to ban all magazines above 14 and below 10, as it has the lowest death and wound rate, and they love using pure correlations all the time to assert causation.