
L.A.’s Example
L.A., home of the original gangster paradise, accidentally provided us a great example of the interplay between gangs, policing, and homicide rates.
Takeaways
- Increasing gang activity leads to lower homicide clearance rates.
- Lower homicide clearance rates, in turn, facilitate/encourage gang activity.
- This led people in L.A.’s Southeast Division (i.e., south central) to having a chance of being murdered at a rate of 1 in 2,200, almost 9X higher than the national average.
A spontaneous chart appeared
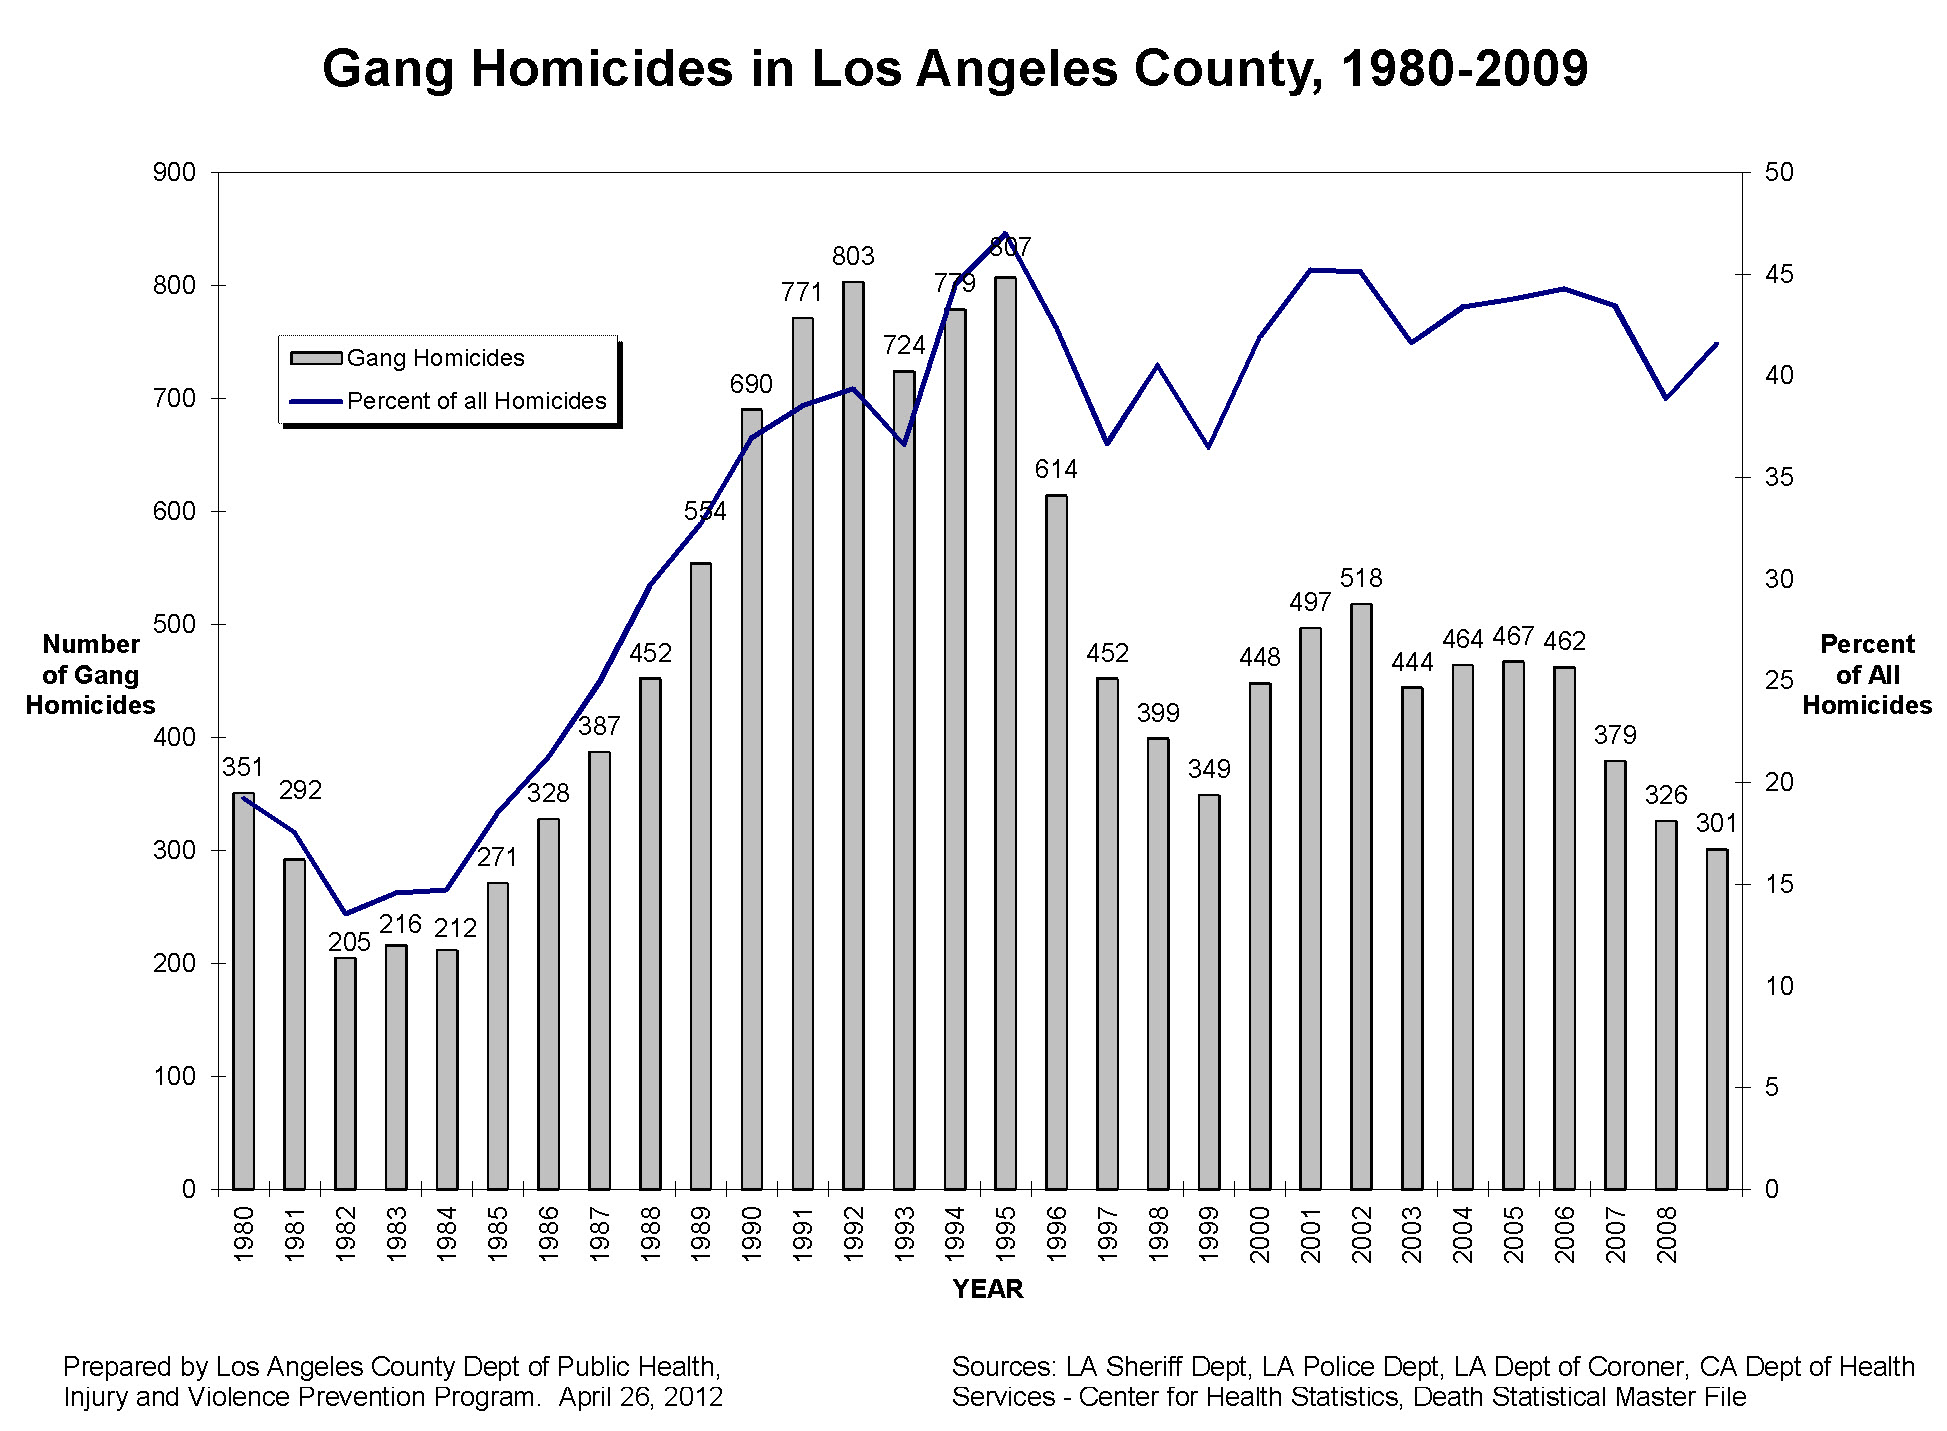
The chart above landed on our desk among the never-ending flow of new data (we are busy little beavers here at the Gun Facts Project).
What was interesting was that this was one of the more concise bits of data proffered by local law enforcement, measuring both their homicide rate and the percentage of homicides that were gang-related.
For Los Angeles gang homicides as a percentage of all homicides became institutionalized in the 1980s and 1990s. This is no coincidence given the history of South Central L.A.
Crips founder Raymond Washington was sent to prison for a few years in the early 1970s. He was released in 1976 and murdered in 1979.
Before he went in, gang disputes were more typically resolved with bodily combat, at worst escalating to the use of knives. Washington was shocked and horrified when he got out of prison to see that the Crips were now in open gun warfare with the Bloods. But he had only 3 years to be horrified before he was shot.
The chart above shows that as gangs grew and as their fatality-first mentality became institutionalized, the percentage of homicides attributable to gangs skyrocketed. Even in years when the number of gang homicides declined for one reason or another, their percentage of all homicides remained very high.
One of the reasons for this is that a lot of homicides don’t get solved throughout America, but especially in places like Los Angeles and Chicago. In Los Angeles by the first decade of this century, the homicide clearance rate had dropped to 46.5%.
That means over half of the people who committed a murder in L.A. got away with it.
Superkillers and clearance rates
Two things are important to know about gangs and cops when it comes to homicides and guns.
First is that within street gangs there are what we at Gun Facts call “superkillers”. These are individuals who have zero hesitation to kill when it comes to defending or advancing their gang.
We first caught wind of this 20 years ago when the city of Oakland, California stated publicly that every gang member they were holding on a homicide charge was the lead suspect in two to three other homicides. That ratio has been echoed by other large metropolitan areas over the years. And those 2 to 3 other homicides were simply the ones where the police found some sort of meaningful linkage. The actual body count might be significantly higher.
[ED: this explains why city-level police functions that focus on gang leadership and known superkillers tend to be very effective in driving down local homicide rates]
And this gets us back to homicide clearance rates. Super killers who are not identified, arrested, tried, convicted, and imprisoned merrily go about their business, killing more people. The lower the clearance rate the higher the percentage of homicides that are gang-related remains.
L.A.’s fade away
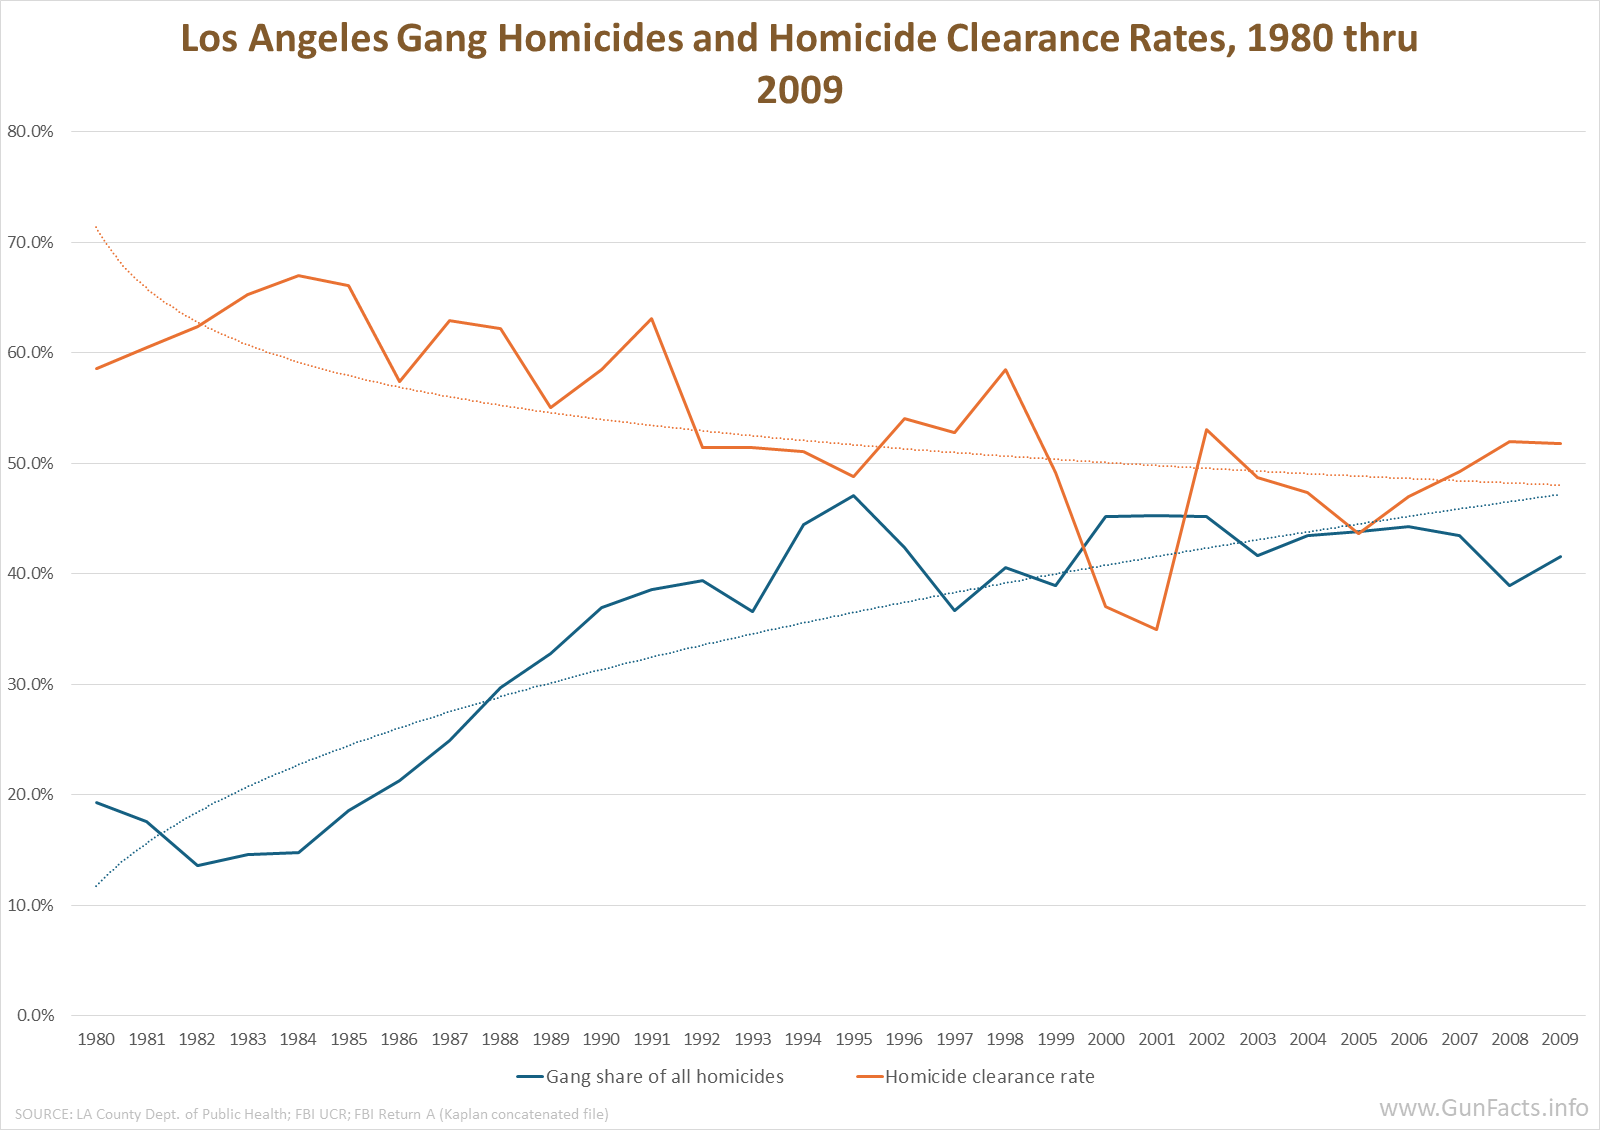
We face a small chicken-and-egg problem, but one that’s easily resolved.
In Los Angeles which came first: the decline in homicide clearance rates or the increase in the gang’s share of homicides? They both are a bit covariant but we see that the steep rise in gang homicide share clearly outpaces and slightly precedes the decline in homicide clearance rates.
In other words the Los Angeles law enforcement community was underfunded in such a way that they could not adapt to the changing street gang realities.
And that’s a shame because some people have estimated that violent gang crime costs the taxpayers and victims more than $3.5 billion every year in LA County. 1
LAPD’s budget is only $2.9 billion.
Notes:
- Phase III Final Report: Cityide Gang Activity Reduction Strategy; Chief Legislative Analyst; 2007 – adjusted for inflation ↩
Comments
L.A.’s Example — No Comments
HTML tags allowed in your comment: <a href="" title=""> <abbr title=""> <acronym title=""> <b> <blockquote cite=""> <cite> <code> <del datetime=""> <em> <i> <q cite=""> <s> <strike> <strong>