
Divining the Decline
American violent crime in 2025 dropped to rates not seen since Eisenhower was president.
But FBI data anomalies are persistent, so take the 2025 measurement with a shaker of salt until we have a full year of catch-up reporting by local agencies.
Regardless, things are better. It behooves us to try to understand why.
Take-aways
- Large cities saw significant declines in violence and gun violence while smaller ones did not.
- Within the large agencies, focusing on gangs and improving police agency staffing were the two most contributive causes.
Our perpetual pesky note on data quality
Criminology data has always had exceptions, but we are still weeding our way through the post-2021 FBI conversion from their old Uniform Crime Reporting (UCR) system to the newer National Incident-Based Reporting System (NIBRS). Though vastly improved from the switchover year, there is still frequent underreporting and misreporting. In some cases this makes the 2025 violent crime rate look lower than it actually is.
Louisville, KY is an example. When we used the FBI data to start our analysis, the FBI showed that Louisville had 19 homicides in the year 2025. However, news reports with local law enforcement making announcements said that the actual number of homicides was 108.
Some of this discrepancy is understandable. Some crimes committed in one year do not get fully reported until the next year after there have been procedural issues, data checks, and some other things. Usually the gap is small, typically less than about 3% of crimes.
That said, we find it odd that one agency says something in public and then reports something different to the FBI. Throughout this report we rely on the FBI data but we did a lot of screen scraping to make sure that the 2025 data was accurate.
The surge and the fall
Some media outlets were breathlessly reporting about the steep fall in violent crimes after the pandemic. Oddly, very few of these news organizations bother to report the steep climb in violence going into and throughout the pandemic and “defund the police” era. If violent crime fell 10% after rising 10%, it would invoke only a public yawn, and the media hates a boring story.
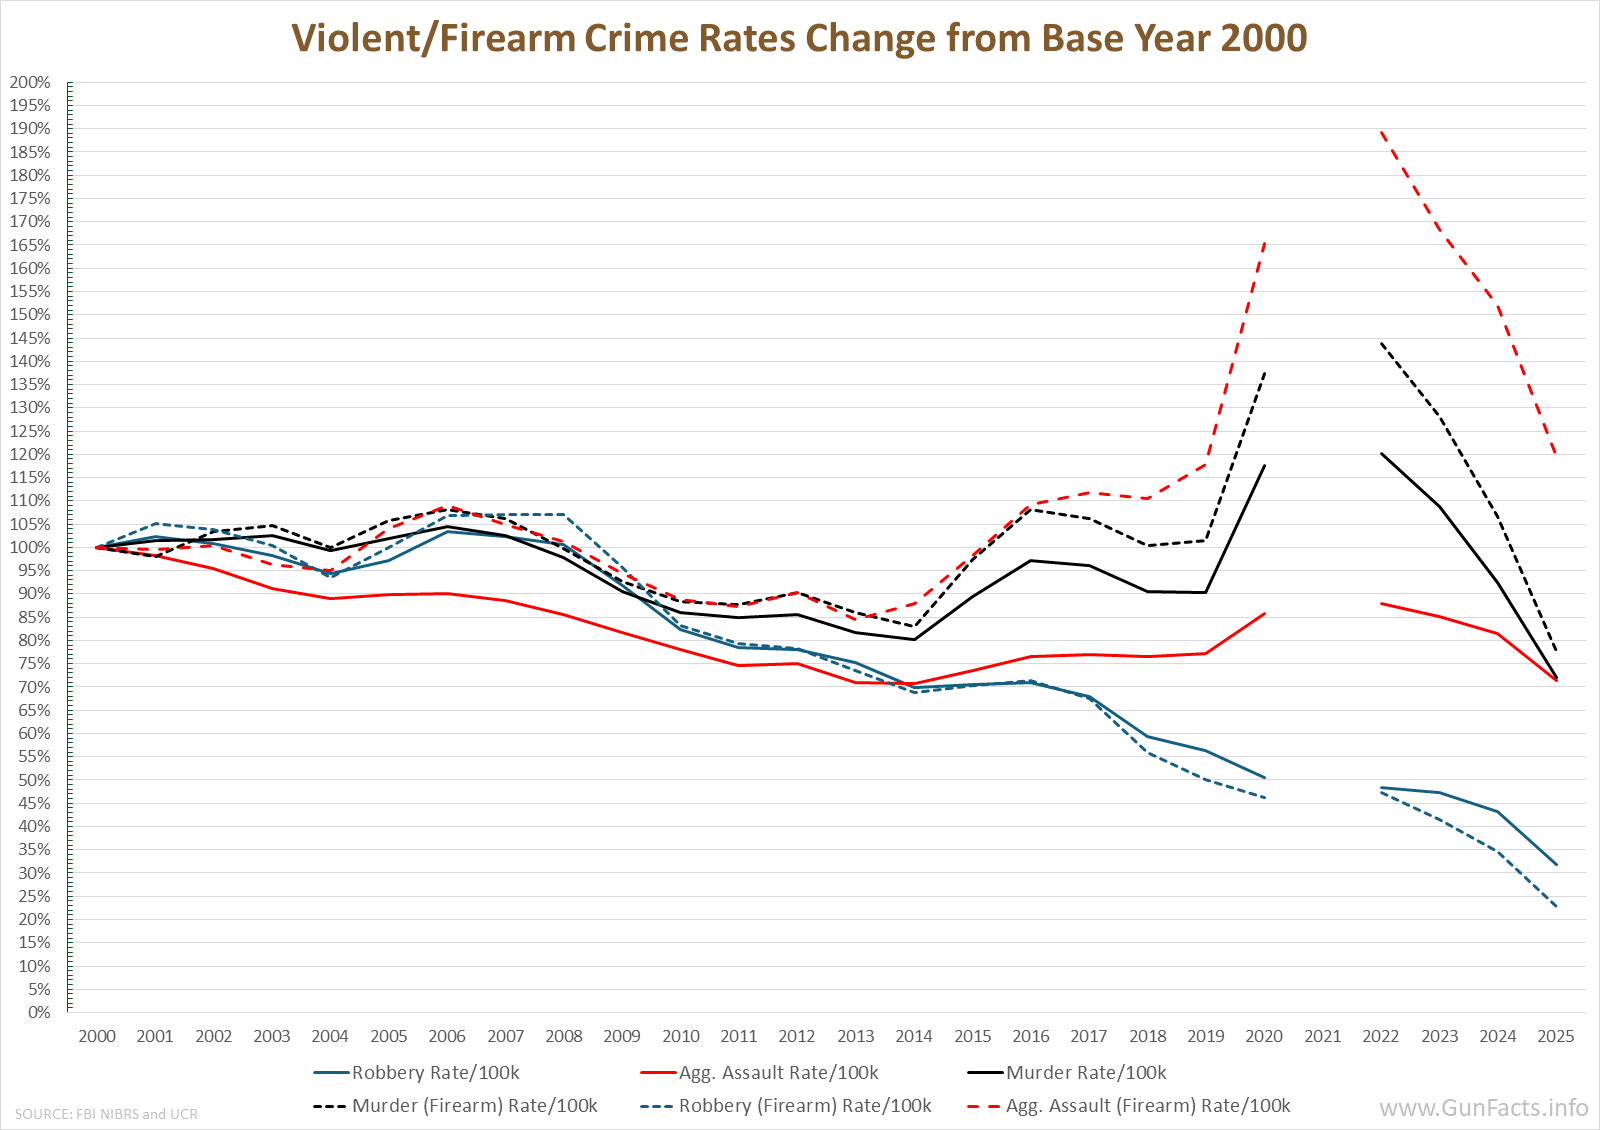 Yet the declines are significant. This chart includes the suspect 2025 data from the FBI, but that is marginally irrelevant.
The main observation here is that aggravated assaults have returned to pre-pandemic levels. Murders have decreased beyond pre-pandemic levels. The rate of robberies declined throughout the pre- and post-pandemic era. And for robberies and homicides, the rate of use of firearms in both of those crimes dropped faster than the overall rate.
Firearm assaults are the exception. Those are actually higher than before the pandemic. That’s a strange little conundrum, in that more people are being assaulted with firearms but fewer people are being killed with them.
City size matters
At this point we’re only going to focus on murders because the available and stable FBI data does not give us adequate information about firearm use in crimes other than murders. 1
| Population Tier | Avg Rise % (2018→2021) | Avg Fall % (2022→2025) | Avg Net % (2025 vs 2018) |
| 100,000-149,999 | 89.1% | 1.4% | 22.6% |
| 150,000-249,999 | 59.1% | 3.0% | 12.8% |
| 250,000-499,999 | 48.3% | -4.6% | 10.5% |
| 500,000-999,999 | 78.8% | -34.1% | 4.8% |
| 1,000,000+ | 45.6% | -41.6% | -9.9% |
For murders we see a really interesting pattern. Outside of the largest major cities the total homicide rate was higher than pre-pandemic and at pandemic levels. In cities with less than a million people, the homicide rate actually went up even though the national average was falling.
But we see that in those huge metropolitan areas the homicide rate fell significantly: take a large percentage shift and combine it with a high population and you have an appreciably large drop in the number of people being dropped.
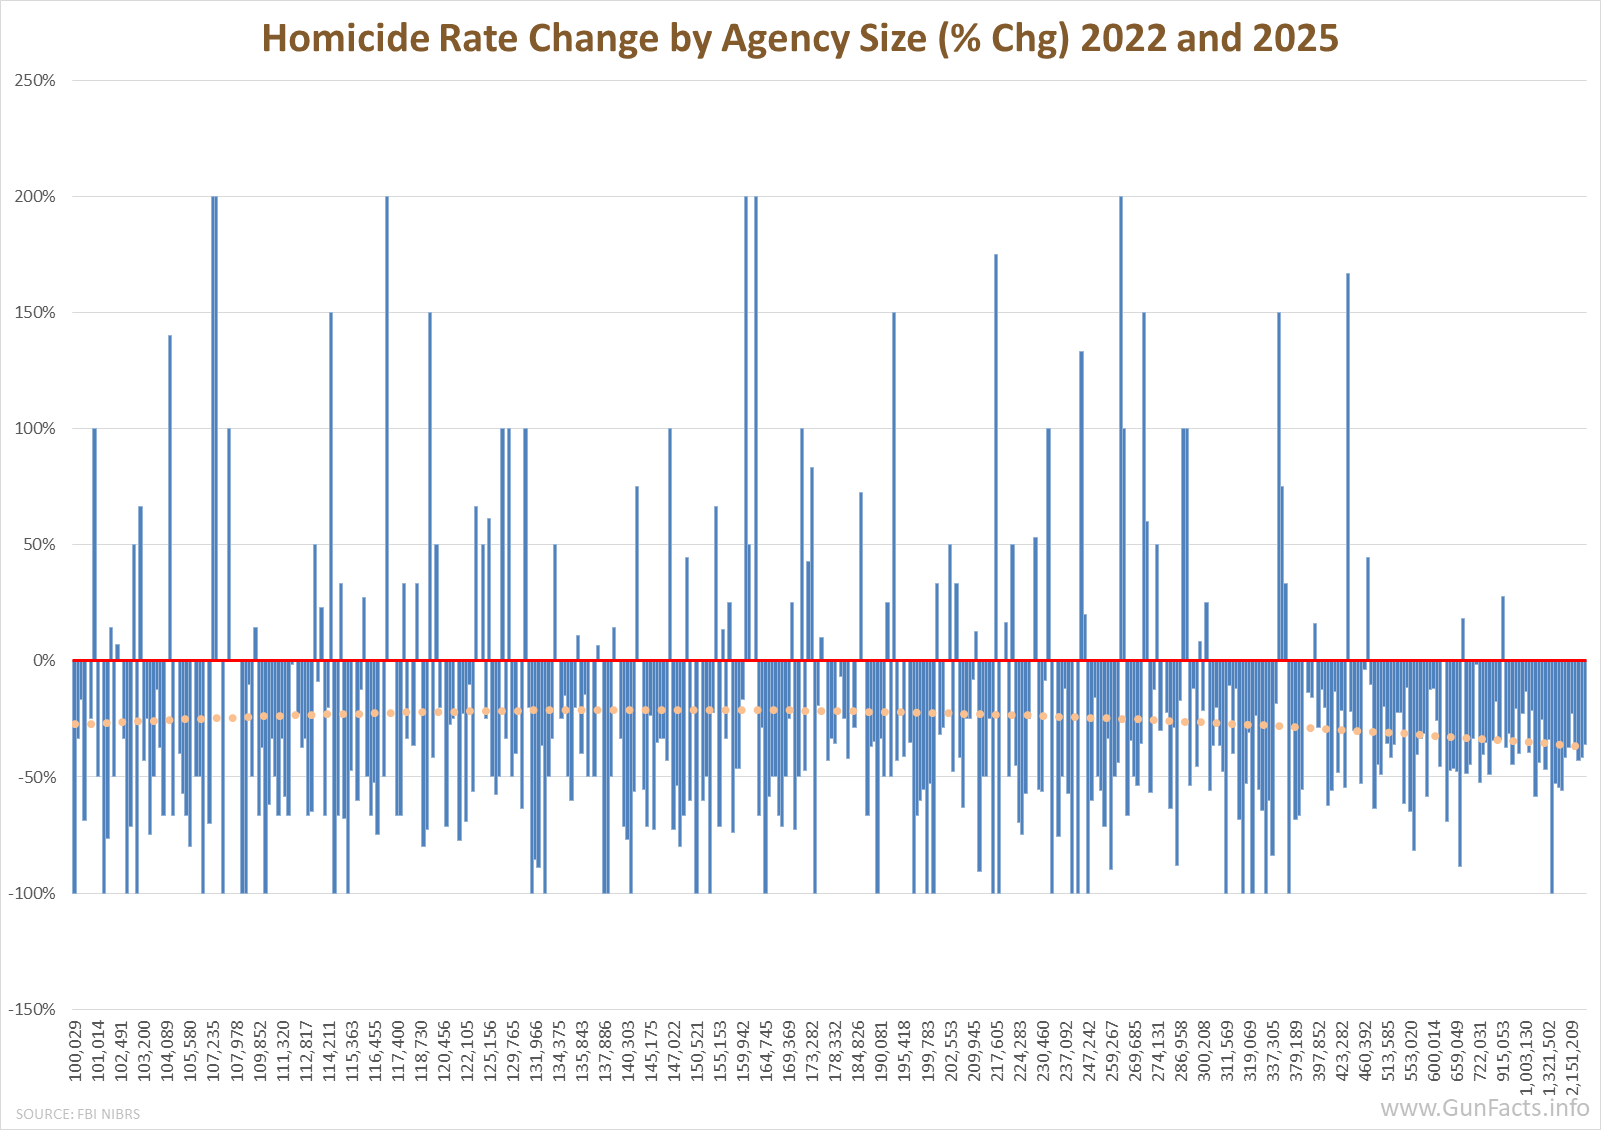 Indeed, if it wasn’t for huge spikes in a few very specific agencies, we might have seen the middle-tier agencies showing a combined net drop in homicides as well. But consistently, among the larger agencies, there were few that reported upswings, which allowed them as a group to show an average decrease.
As we proceed we’re going to amalgamate all of the agencies with population coverage above 500,000, because even within sight of these two population tiers we see differences between agencies. Also from this point on, we use a data correction for agencies that had inexplicably large drops by verifying the 2025 FBI reporting with local news media end-of-year reporting. Where the difference between the FBI’s numbers and the local reporting was significant, we substituted local reporting numbers.
Why did crime fall faster in big cities?
Cities of all sizes saw their violent crime rate go up during the pandemic and the riot era. But afterwards the smaller agencies continued to see a rise in violence, whereas the larger agencies saw a decrease.
It’s beyond the scope of this study to measure all agencies for even a manageable subset of variables, so we’ll just turn our attention to the two top tiers in terms of covered population and test a handful of variables to see what might have made a difference.
In doing so we run into our first problem.
Not every agency faced the same number of variables. All agencies saw stabilization in the amount of illicit fentanyl being consumed, but only 36% of the large agencies had focused gang deterrence programs. Thirty-nine percent were in states that had legalized marijuana, which may have led to lower alcohol consumption rates, but 63% improved their homicide clearance rates, meaning that more people who committed murders were found, arrested, and prosecuted.
In this case, normal multivariate regressions were not practical; and the situation was complicated by some of the factors being binary (e.g., did or did not legalize marijuana), while others were data series (e.g., sworn officer staffing levels).
Instead, looking at the average across all of the large agencies for the range in the rate of firearm homicides against 13 variables 2, we see that the two areas where the firearm homicide rate changed most aggressively was where agencies had targeted intervention programs (forced deterrenc) and where their agency staffing rebounded significantly. Recall that in the 2020 and 2021 era, a lot of people left law enforcement or left their agencies due to the pandemic, due to riots, and due to local “defund the police” activism. Some agencies were able to rehire and restaff faster than others and that was one of the two things that made the most difference.
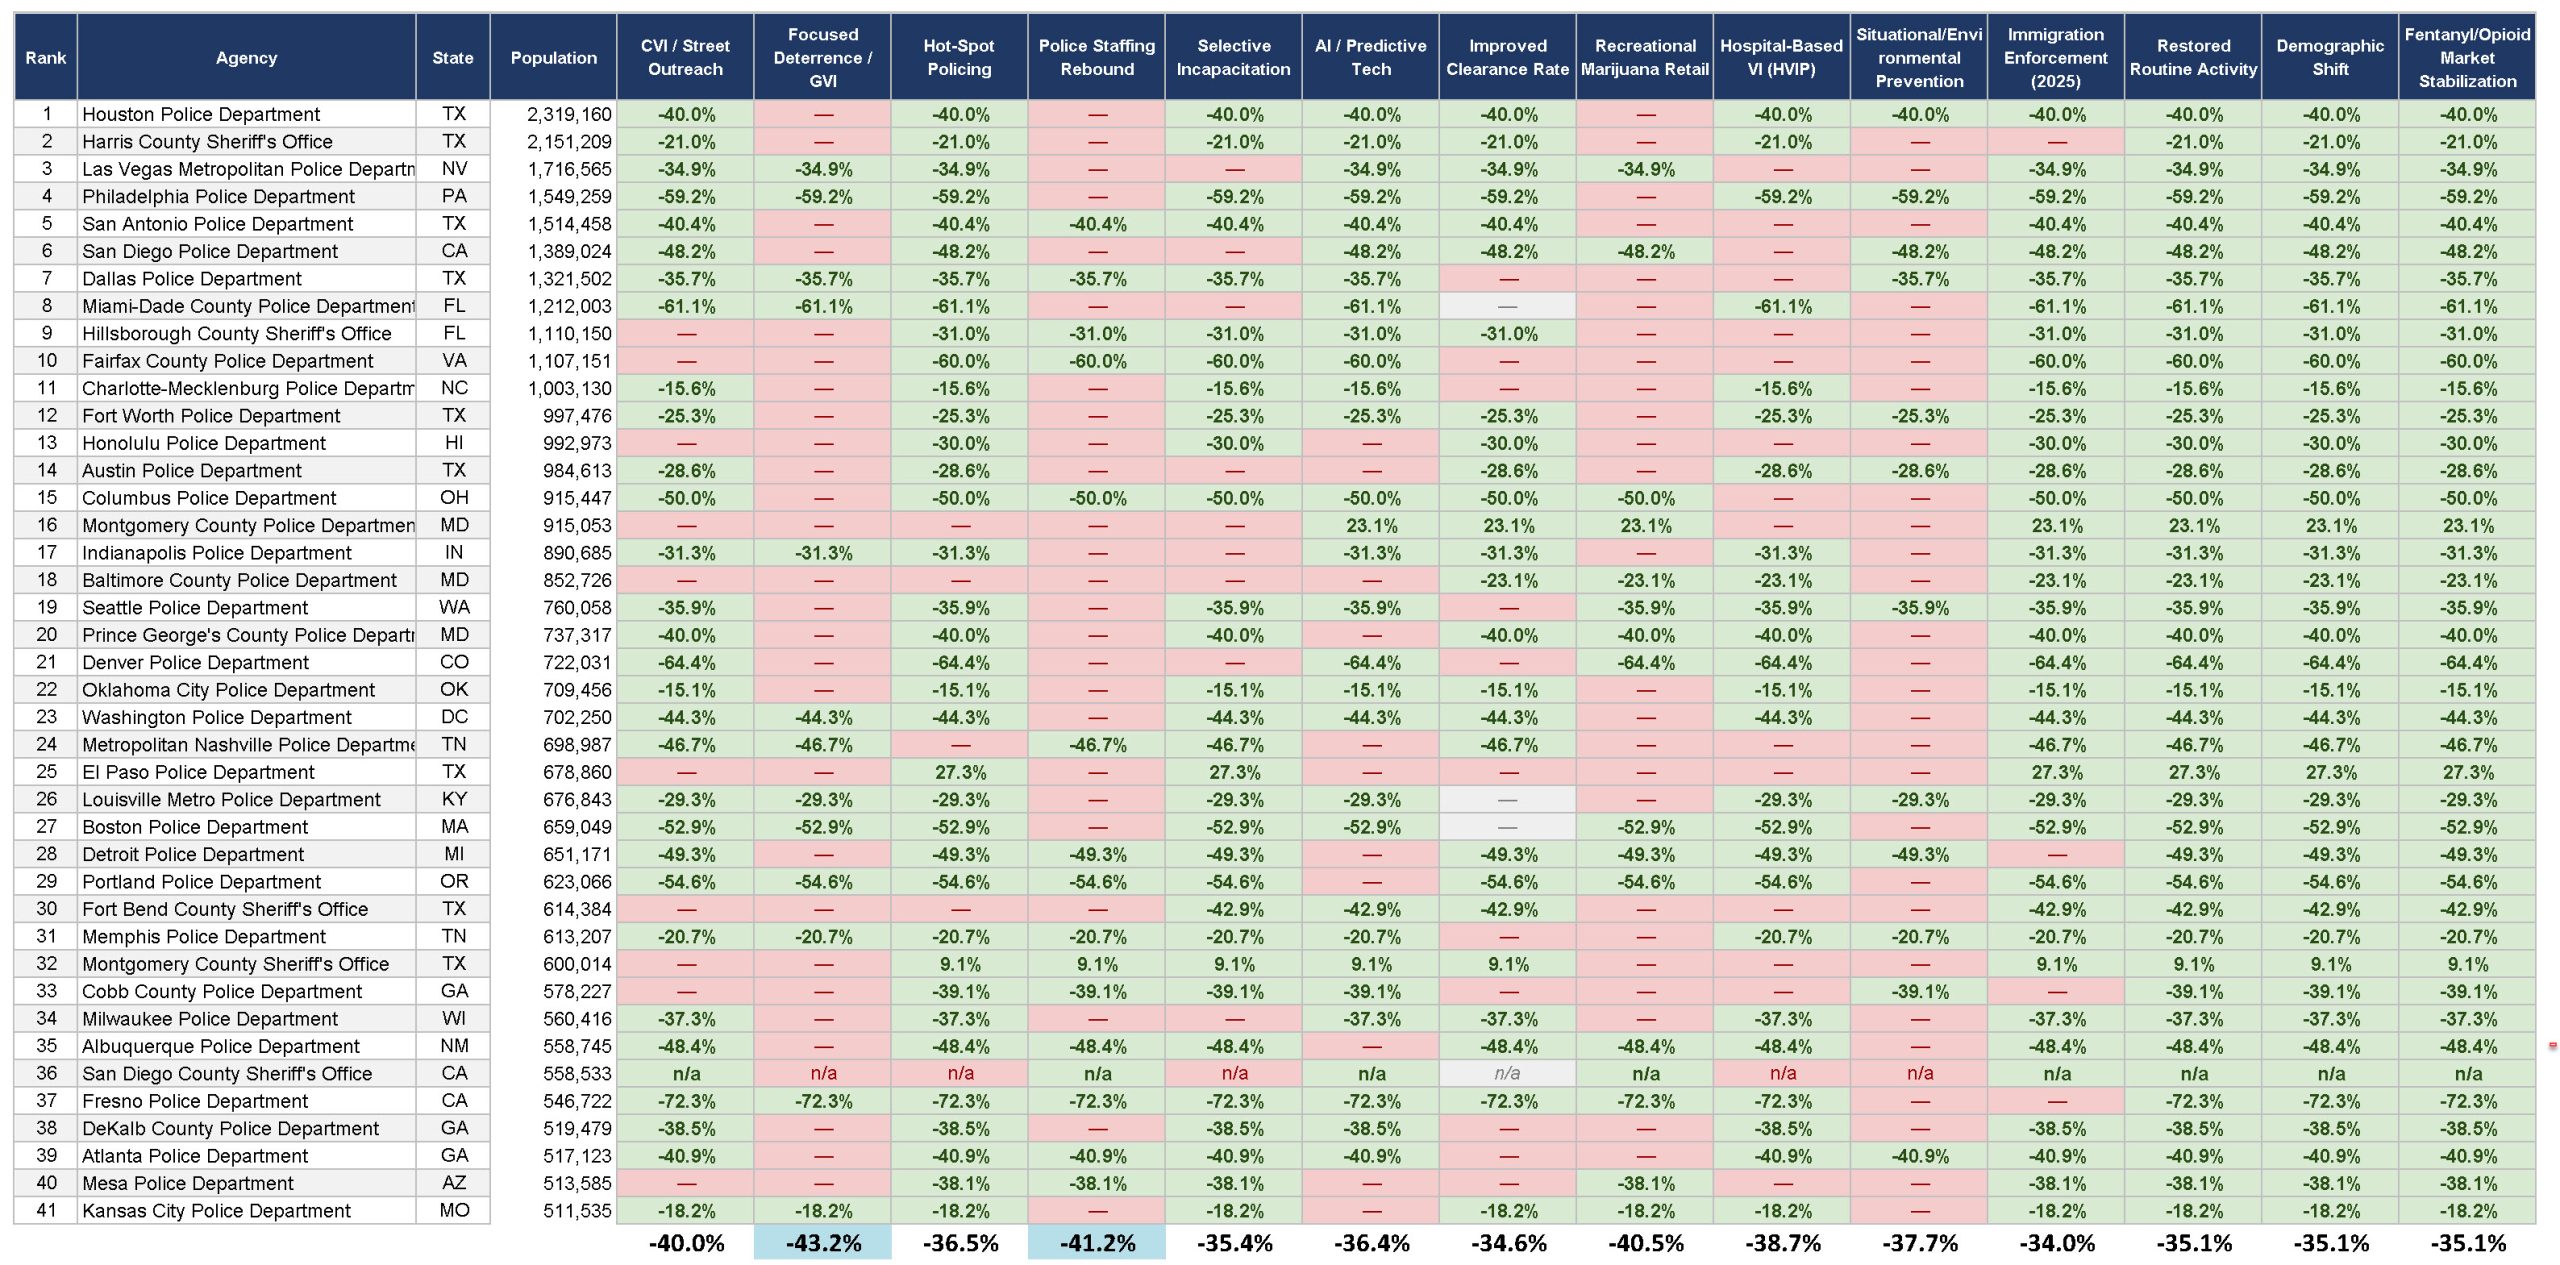
Major metros in 13 test variables, but also showing where data inconsistency complicates things
But other factors were running close behind as well. CVI (Community Violence Intervention) programs, where government-led community workers attempt to reduce the motivation for violence in dangerous neighborhoods, were associated with a fair amount of decline as well. And all joking aside, the increased availability of recreational marijuana is also associated with fewer homicides at a robust level (well, one joke: that stoners lack the motivation to get off the couch, much less go out on the street and shoot somebody).
Why did gun violence fall in the big cities and not the smaller ones?
The question remains: why does this reduction show up in the large cities and not the smaller ones? Major metros have the advantage of money and organization. When it came time to put the pandemic behind us, they were able to staff up rapidly. They were also able to reignite their focused deterrence programs, which are typically focused on street gangs. Meanwhile the lower-population areas were suffering from the spread of street gang culture (thanks to the internet) and did not have the resources to charge out of the gate.
Financial resources and a bureaucracy that can exploit them aside, we at least see what we have seen in other research, namely that sufficient police staffing and focusing on the primary sources of gun violence create the largest positive effect in the shortest amount of time.
Notes:
- The long-running multi-decadal FBI Supplementary Homicide Reports do provide weapons information. But the FBI data preceding the NIBRS switchover in 2021 did not provide weapons information for assaults and robberies. ↩
- Community violence intervention (CVI) / Street Outreach, Police Staffing Rebound, Improved Clearance Rate (pp change, continuous), Focused Deterrence / GVI, Hot-Spot Policing, Police Staffing Rebound (% chg officers/capita, continuous), Selective Incapacitation, Recreational Marijuana Retail, Improved Clearance Rate, Hospital-Based Violence Intervention (HVIP), AI / Predictive Tech, Situational/Environmental Prevention, Immigration Enforcement (2025) ↩
Comments
Divining the Decline — No Comments
HTML tags allowed in your comment: <a href="" title=""> <abbr title=""> <acronym title=""> <b> <blockquote cite=""> <cite> <code> <del datetime=""> <em> <i> <q cite=""> <s> <strike> <strong>