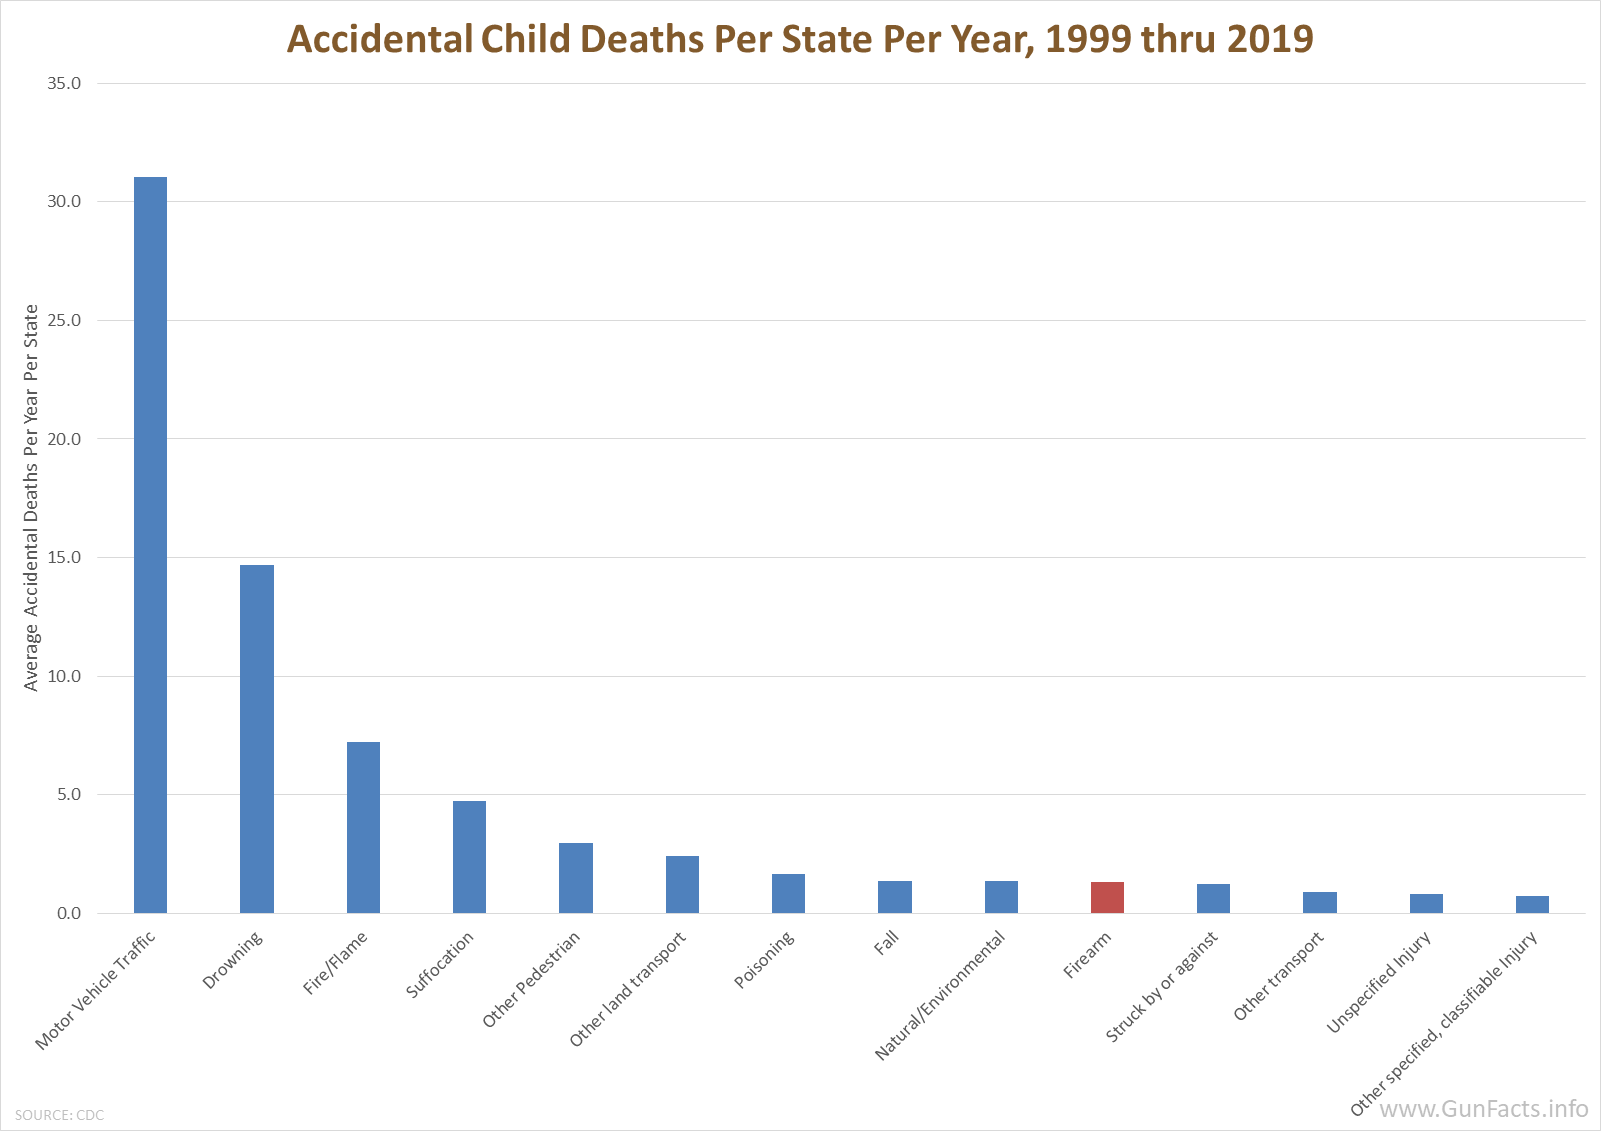
Column chart showing the leading causes of accidental deaths for children in the United States, averaged over the years 1999 through 2019

Column chart showing the leading causes of accidental deaths for children in the United States, averaged over the years 1999 through 2019
Gun Facts runs exclusively on private donations (and the spare change Google gives us for hosting ads).
We do not take "institutional" money. We have rejected checks from pro- and anti-gun activist organizations.
Donate now to make sure we continue to provide unbiased information about guns, gun violence and thus help everyone find workable solutions.
The content on this web site is free to use by everyone under American-style "fair use" doctrine. This means you may copy/paste, link to and otherwise make use of all the content herein ... providing you don't change any of it and you give us credit (preferably linking back to our website).
In particular, we encourage you to reuse all the graphics and short sections of text.
For those in the E.U., this is a pre-license. You are not required to seek a specific license from us before using or linking.
For our standard copyright disclaimer, see http://www.gunfacts.info/home/copyright-and-use/
Expand Charts for SharingNearly every chart and graph on Gun Facts is free to share (providing you don't change anything). |
|
|