↓
 
About Gun Facts and Our Projects
  • Home
    • About Gun Facts
    • The Editor
    • Funding
    • Copyright and use
    • Abbreviations and Acronyms
    • Media Resources
    • Advertise on GunFacts.info
    • Cookies and Privacy
  • Infographics
  • Research
    • Bad Research Roster
    • Research Resources
    • Mass Public Shooting Database
  • Blog
  • Books
  • Charts from “Guns and Control”
  • Alerts & Volunteers
  • Journalists’ Gun Issue Guide
    • Why This Guide
    • Data Sources and Reliability
    • Basic Data and Trends
    • Mass Public Shootings (MPS)
    • How to Identify Bad Research
    • Issues Under Debate
    • Issues Not Widely Discussed
  • Donate

Gun Facts

Gun Control Policy Information

Gun Policy Topics
  • Assault Weapons
  • Children and Guns
  • Availability of Guns
  • Crime and Guns
  • Mass Shootings
  • Police and Guns
  • Guns and Crime Prevention
  • Concealed Carry
  • Licensing and Registration
  • Accidental Deaths & Injuries
  • Laws, Social Costs
  • Microstamping
  • Ballistic Fingerprinting
  • 50 Caliber Rifles
  • Guns in Other Countries
  • Second Amendment
  • Assorted Gun Insights
  • Miscellaneous Gun Policy Information

Category Archives: Crime and Guns

Post navigation

← Older posts
Newer posts →

Firearm Violence, (non) Surprises

Gun Facts Posted on 2024/11/22 by Editorial Team2024/12/26
Firearm violence reporting rates to police and justifications for non-reporting by victims 2018 thru 2022 - BJS

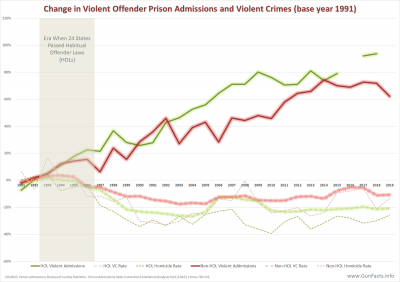
The Bureau of Justice Statistics (BJS) gives government a good name. At a time when the FBI’s crime data program switch-over caused massive under-reporting and the COVID+defund+riot era spiked crime, BJS once again provided data that helps understand the realities. Most of the data was unsurprising, but some stood out. Take-Aways Non-fatal gun violence fell alongside homicides after 1993. Much of the non-fatal data appears associated with gang demographics and modes. Half of gun violence is not reported to the police, relying instead on “street justice.” The Report click any image to enlarge The boringly titled report “Trends and Patterns in Firearm Violence, 1993–2023” provides a three-decade long look at sundry aspects of guns, violence, crime, gangs and so forth. The starting date for the report was the first of four straight years when 24 states, with over 50% of the nation’s population, passed habitual offender laws. This is a … Continue reading →

Posted in Crime and Guns | Tagged bureau of justice statistics, non-fatal firearm crime | Leave a reply

Pondering Permits

Gun Facts Posted on 2024/08/28 by Guy Smith2024/12/26
Washington Gun Suicide Rate Differences with No Permit to Purchase Laws, +-5 Years at Enactment

Though it is difficult to ignore the possible unconstitutionality of requiring a permit to exercise an enumerated right, some states require residents to obtain a permit before they can purchase a handgun (or any gun). But do these permits make any difference? Some activist groups say so. Some academic studies say either yes or no. That a minimum of 43% of crime guns come from underground markets would indicate any effect would be marginal. After that… it gets complicated. Takeaways Permit-to-purchase laws have no material effect on gun homicide or suicide rates. The 1993-era anti-crime legislative movement limits pure test cases. A Dearth of Data Permit-to-purchase (PTP) laws have been touted as preventatives for homicides, suicides and gunshot injuries. We can measure the first two, not the last.

Continue reading →
Posted in Crime and Guns, Licensing and Registration, Suicides | Tagged homicides, licensing, permit to purchase, suicides | Leave a reply

Underreporting Gun Crime

Gun Facts Posted on 2024/07/16 by Guy Smith2024/07/16
County Gun Homicide Reporting with CDC (sans suppressed) and NIBRS 2022

“The crime rate isn’t going down,” moaned a Twitter user. “The big cities are purposefully not reporting crime.” Neither of the above is accurate, but there is a crime reporting problem, in that some people may be misinterpreting data … for political gain. Take-aways There is significant, general nonreporting into the FBI’s new NIBRS system. Some well-documented hot counties with large populations are not reporting, which masks their gun crime and street gang data, including gun homicide rates. The systems that the Federal government has in place to encourage reporting into NIBRS are ineffective. NIBRS Mayhem For decades, the FBI orchestrated the Uniform Crime Reporting system (UCR). This was a nationwide program whereby all law enforcement agencies – city, county, state, campus, et cetera – were to report what crime incidents they processed. These were largely monthly counts of major categories of crime (robbery, murder, being a politician). And it … Continue reading →

Posted in California, Crime and Guns, Florida, New York | Tagged cdc, data, fbi, gun crime | Leave a reply

Stolen Guns

Gun Facts Posted on 2024/06/28 by Guy Smith2024/12/26
Primary firearm theft locations 2022

One way criminals gets guns is to steal them, or to buy guns from gun thieves. The question is if this is a major source of crime guns, and where is the leakage occurring? The answers are serious though the data is convoluted. Takeaways A net 154,746 guns (stolen minus recovered) enter the underground in a year. They are overwhelmingly taken from civilians. Most disappear from vehicles, not homes. Public carry is not a predictor of gun theft rates, but the adult population is. Gun theft rates are not covariant with gun homicide rates. A crabby note about data Data quality is the bane of research, and data quality on this issue is inconsistent. We’ll include rants about data as we explain our findings, but for starters, we’ll note that snapshot data (i.e., a one-year picture) is divorced from long-term data, and the long-term data required us to triangulate factors. … Continue reading →

Posted in Concealed Carry, Crime and Guns, Crime Control | Tagged crime guns, stolen guns | 1 Reply

De-Policing and Death

Gun Facts Posted on 2024/03/14 by Guy Smith2024/03/17
Chicago - homicide incidents during George Floyd riots

Does reducing the number of police on the street cause crime to go up? It would seem obvious, but we at Gun Facts don’t like to assume anything. So we scanned about and found some analysis. According to two academic criminology papers, the answer is that reducing police presence on the streets absolutely increases homicides, and gun homicides. And it mainly affects poor people of color in major metropolitan areas. This agrees with our “Top 15 Murder Counties” analysis which showed that a lack of policing, and the associated lack of case clearances for homicides, lead to more gun murder. TAKEAWAYS: The mode of de-policing doesn’t matter. This hypothesis was tested against: Pandemic pullbacks (for public health safety and police outage reasons) Pullbacks in the face of the George Floyd riots De-staffing via “defund the police” and “criminal justice reform” movements The largest impact was in areas normally associated with … Continue reading →

Posted in Crime and Guns, Police and Guns | 1 Reply

Habitual Effects

Gun Facts Posted on 2024/01/19 by Editorial Team2024/04/27
Prision admissions, violent crime and homicide rates, difference between states with habitual offender laws (three strikes) and those without, 1991 thru 2019

Repeat offenders in prison are not committing crimes on the streets. This was proven when in a national revolt over spiraling crime, 24 states passed habitual offender laws in just four years. The effects are compelling. Take-aways States with habitual offender laws: Incarcerate 73% more violent offenders. Reduce violent crime by 85%. Reduce homicides by 49%. The Prelude to Three-Strikes

Continue reading →
Posted in California, Crime and Guns, Crime Control | Tagged habitual offender, three strikes, violent crime | 3 Replies

Top 15 Murder Counties

Gun Facts Posted on 2023/08/27 by Guy Smith2025/08/26
Homicide-Population Gap, Clearance Rates and Gang Age Residents by County - 2018

When 0.5% of all counties, with 8% of the people, account for 25% of the homicides, you must pay attention. When those same counties, on average, have five times the murder rate than the average of all other counties, you must pay attention to details. When those 15 counties are also known to be dominated by a single city with a reputation for gang violence, you must pay attention to why people in those cities are different than the rest of the country. But, what makes those 15 counties uniquely violent? Major Takeaways 1% of counties with any homicides have 24.9% of the homicides, but only 8.4% of the population in counties where gun homicides occur. The states with these Hot 15 Counties have evenly distributed gun law scores ranging from A- to F by a gun control advocacy group. A number of factors (including population density, teen-age poverty, and … Continue reading →

Posted in Crime and Guns, Crime Control, Police and Guns | Tagged county, firearm homicides, policing | 10 Replies

Tracking Transgressors

Gun Facts Posted on 2023/06/08 by Editorial Team2024/04/27
NIBIN Primary Case With Links To Additional Cases

In a perfect world, a gun would tell you who used it in a crime … over and over again. Such is the stuff of science fiction. Gun serial numbers really don’t help (more on that later). But one program and set of sciences is helping to expose repeat offenders and maybe get serious bad actors off the streets. Take Aways 96% of guns recovered in crime are linked to one or more additional cases. 83% of guns were used in two or more crimes. These statistics may be low due to staffing problems in forensic labs. Repeat offenders and guns We know from decades of criminology and some indirect evidence that among the criminal class, there are some super predators who repeatedly misuse guns. Ignore for the moment perps like ATM muggers and liquor store bandits who rarely fire their guns at anyone (instead, the gun is used as … Continue reading →

Posted in Crime and Guns, Crime Control | Tagged crime guns, NIBIN, repeat offenders | Leave a reply

Rust Pipeline

Gun Facts Posted on 2023/04/29 by Guy Smith2023/05/09
Imported Traced Crime Guns from Neighboring States - 2019

There is no “iron pipeline” of guns trafficked from low gun control states to high ones. There is a rust pipeline of legally migrating guns mainly between neighboring states. Take-aways Most crime guns are retailed in the state where they were recovered, including in high gun control states. Most intrastate guns come from neighboring states, including other high gun control states. Most guns legally follow owners when they move between states, which frequently are neighboring states. Approximately 6,000,000 guns at minimum move legally between states each, and of these, 433,000 move between neighboring states Crime guns are largely local One reality is that most crime guns are retailed in the same state where they were recovered. Across all states, 68% of traced guns were retailed in the same state where they were recovered. But there are significant variations. Due to decades of restrictions, Washington, DC (not a state, but worth … Continue reading →

Posted in Availability of Guns, Crime and Guns | Tagged gun trafficking, iron pipeline | 1 Reply

Medicated Murderers

Gun Facts Posted on 2023/04/14 by Guy Smith2026/02/15
Mass Public Shooters Prescribed Psychotropic Meds 1966 thru 2020 - five year segments

Psychiatric prescribing of psychotropic medications may be contributory to mass public shootings (MPS). Main Takeaways Increased use of psychotropic medications is associated with increased frequency of MPS. Non-psychiatric prescribing of these drugs is not strongly associated with overall MPS frequency. Psychotropic medications are associated with elevated rates of homicide, hence also associated with MPS. Perps receiving medications and psychiatric counseling are strongly associated, indicating mental health professionals are not catching warning signs. Over a quarter of a million at-risk and unmanaged adults are statistically likely to have “hostile” reactions from their drugs. A note about data and correlations Before going into a summary, much less the detailed data, know that this is not a one-problem-fits-all conclusion. There is no singular driver of MPS. What is herein is an exploration of trends in how America is (mis)medicating the population and how it may well contribute to some/many MPS. The data is … Continue reading →

Posted in Crime and Guns, Mass Shootings | Tagged mass public shootings, mental health, psychotropic medications | 1 Reply

Post navigation

← Older posts
Newer posts →

“What Gun Facts does – the assiduous data-gathering, the numeric analysis, and the reporting – is indispensable to the development of rational public policy; indispensable as the few voices of reason against the winds of polemic falsehoods.” Note from a Gun Facts fan

Copyright © 1998-2026, Guy Smith. "Gun Facts®" is a registered trademark | Catalog of Canards Cookies and Privacy
↑
Cookie Consent
We use technologies like cookies to store and/or access device information. We do this to improve browsing experience and to show (non-) personalized ads. Consenting to these technologies will allow us to process data such as browsing behavior or unique IDs on this site. Not consenting or withdrawing consent, may adversely affect certain features and functions.
Functional Always active
The technical storage or access is strictly necessary for the legitimate purpose of enabling the use of a specific service explicitly requested by the subscriber or user, or for the sole purpose of carrying out the transmission of a communication over an electronic communications network.
Preferences
The technical storage or access is necessary for the legitimate purpose of storing preferences that are not requested by the subscriber or user.
Statistics
The technical storage or access that is used exclusively for statistical purposes. The technical storage or access that is used exclusively for anonymous statistical purposes. Without a subpoena, voluntary compliance on the part of your Internet Service Provider, or additional records from a third party, information stored or retrieved for this purpose alone cannot usually be used to identify you.
Marketing
The technical storage or access is required to create user profiles to send advertising, or to track the user on a website or across several websites for similar marketing purposes.
  • Manage options
  • Manage services
  • Manage {vendor_count} vendors
  • Read more about these purposes
View preferences
  • {title}
  • {title}
  • {title}

Feed Us!

Gun Facts runs exclusively on private donations (and the spare change Google gives us for hosting ads).

We do not take "institutional" money. We have rejected checks from pro- and anti-gun activist organizations.

Donate now to make sure we continue to provide unbiased information about guns, gun violence and thus help everyone find workable solutions.

Donate Now!

Copyright License

(Once-a-year notice mainly for folks in the E.U.)

The content on this web site is free to use by everyone under American-style "fair use" doctrine. This means you may copy/paste, link to and otherwise make use of all the content herein ... providing you don't change any of it and you give us credit (preferably linking back to our website).

In particular, we encourage you to reuse all the graphics and short sections of text.

For those in the E.U., this is a pre-license. You are not required to seek a specific license from us before using or linking.

For our standard copyright disclaimer, see http://www.gunfacts.info/home/copyright-and-use/

Expand Charts for Sharing

Nearly every chart and graph on Gun Facts is free to share (providing you don't change anything).
To get a larger version to share, just click the chart and the larger version will pop-up in a new tab.