
Incarceration, Handguns and Homicides
“The homicide rate is going up because there are more guns!”
That was a hysterical statement made by a talking head on a television news network. Sadly, this fellow is considered to be a journalist by people who evidently don’t own dictionaries or know of Edward R. Murrow.
At the Gun Facts project, we pour through so much data that recognizing low grade equine effluvium, such as the statement above, is second nature for us. Yet our joy in life is converting hard numbers into knowledge and perspective so that people with high intellects (that would be you, kind reader) will see through such comical statements as what the nightly news anchor uttered.
The basic take-away
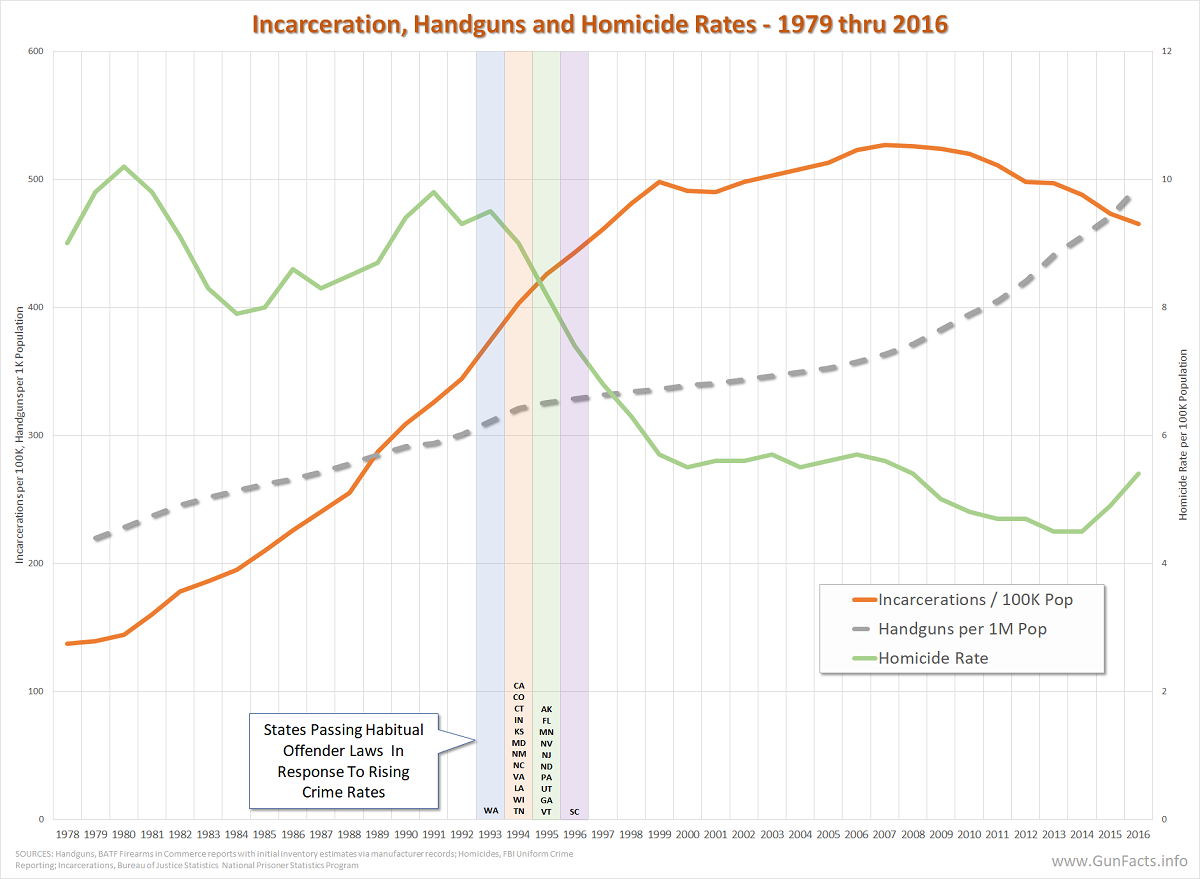
Starting in the early 1990s, after two decades of steadily rising violent crime rates, all forms of crime started dropping. This includes homicides. But after 1993 (more on that in a moment), while the homicide rate in the United States was steadily falling, the supply of handguns kept rising steadily.
If the basic theory as pontificated by the undereducated “journalist” held true, the rising supply of handguns – the primary tool of choice for homicides in the US – would have gone up, not down. Firearms account for 56–74% of homicide deaths 1 depending on the year. Though slightly variable, and ignoring the nadir year of 2001, we see a range of 65–75% of homicides being committed with guns since 1993.
That said, post-1993, stockpiling guns didn’t make things worse on the homicide front; things kept getting better. But why were there fewer shootings?
Ticked-off Americans
The rising crime rates of the 1970s and 1980s led to a citizen’s revolt of sorts. Starting in 1993, states began enacting “habitual offender” laws. These laws targeted thugs who kept committing crimes with the goal of “keeping them off the streets” (and we know from decadal Bureau of Justice Statistics reports that “the streets” are where criminals get their guns).
These laws were most commonly of the “three strikes” variety. Ignoring whether these laws were poorly written and maybe went too far, we see in the chart above that as more and more people entered and stayed in the prison system, the more the homicide rate dropped even as the per capita supply of handguns kept rising. With nearly half of US states passing such laws in a four-year window, and a handful of states already having them on the books, the cause-and-effect relationship is highly probable.
We know from a scatter-shot of criminology studies that repeat violent offenders are responsible for the majority of homicides. As cited elsewhere on Gun Facts, we note that the average street gang member held for one homicide is the lead suspect in three homicides, on average. Hence, once America started putting shooters – or people who might graduate into becoming shooters – into prisons for extended stays, there were fewer shootings.
All while the handgun supply went up… and up… and up.
Limitations
There are other factors aside from habitual offender laws. Many have pointed out that there were confounding factors such as changes in demographics, earlier changes in attitudes about abortions which led to demographic changes, a post-cold war economic boom, et cetera. Grafting all that is more than we at the Gun Facts project will take on this week. But even if those factors were significantly influential, they still deny the basic premise that the supply of guns leads to more violent crime.
Your job is to share the opening graphic on social media so the next time a talking head on a network news program says something uneducated, your friends and neighbors will change the channel.
Notes:
- Centers for Disease Control, WONDER database ↩
Great graphic and message! Of course the left will say everything is different in the last 5 years that you don’t graph, presumably because the data is not yet compiled from the various sources.
Thanks for the compliment on the graphic.
If anyone is worries about it, you are right in that not all data source report to the current year. CDC WONDER cuts off at 2016 (as of the date of this post) and old FBI UCR data is not easy to fetch anymore.
That being said, the core data showing the pre- and post 1993 citizens’ revolt vis-a-vis rising crime rates if perfectly valid, and that was the point of the analysis.
Hi Guy, Thanks for the timely and relevant comparison. Questions: Handguns in circulation and homicides are straight fact, but (to me, at least) the red line is at risk of being subjective. Can you share how that was derived? (is it just a count of laws in effect that can be earmarked as applicable?) Homicide rates turned and show constant velocity higher from 2014. Did your crew identify a likely cause for that abrupt reversal?
Thanks for the note and sanity check.
The read line, incarcerations,m comes from the Bureau of Justice Statistics and their ongoing National Prisoner Statistics Program. As far as raw data is concerned, it is “gold standard”. They survey the prison administrators of the 50 states,, and the federal prison system, then divide by the U.S. population.
As for the homicide leveling, there are no clear variables we have tested for to show why. But we note that the incarceration rate started to drop shortly before the rise in homicides. This is due, in part, to state governments not liking the expense of running prisons, various judges ordering releases, etc. I won’t say this is a cause and effect relationship, but it is worth pondering.